
Continuously Compounding Interest: Formulas and Graphs
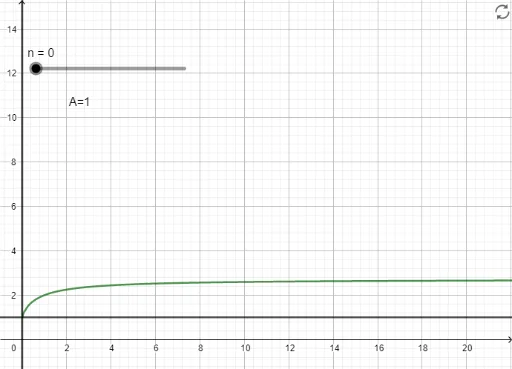
Loading the math board and drawing, please wait…
This GeoGebra example demonstrates the concept of continuously compounding interest through dynamic graphs and formal proofs. It visualizes how compound interest approaches the exponential function e^(rt) as the number of compounding periods tends to infinity, with clear graphical representations of the limit process. The core mathematical concepts include exponential functions, limits, derivatives, and definite integrals applied to continuous growth models. The construction uses GeoGebra commands such as Text to create labels, and defines objects f (function), n (number of compounding periods), eq1 (formula), g (auxiliary function), and text1 (explanatory text), allowing users to adjust parameters and observe the convergence from discrete to continuous compounding. This resource is ideal for high school or undergraduate calculus courses teaching exponential growth, the natural constant e, and limits, as well as for financial mathematics lessons on interest calculation.
GeoGebra Commands & Parameters
Text("A=" + (f(n))) → text1
AI Drawing Prompt Reference
Create a mathematical illustration showing continuously compounding interest. Include a smooth exponential growth curve representing continuous compounding, and several step-like discrete growth curves for different compounding periods. These discrete curves should progressively approach the smooth exponential curve, visually demonstrating convergence as the number of periods tends to infinity. Label the key formula and add explanatory text noting how the growth value approaches the exponential function of e. The layout should clearly highlight the limit process from discrete to continuous.
The prompt above was compiled from the original drawing commands and is for reference only.