
Lab 1: Interactive Exploration of Limits and Multi-Object Mathematics
Loading the math board and drawing, please wait…
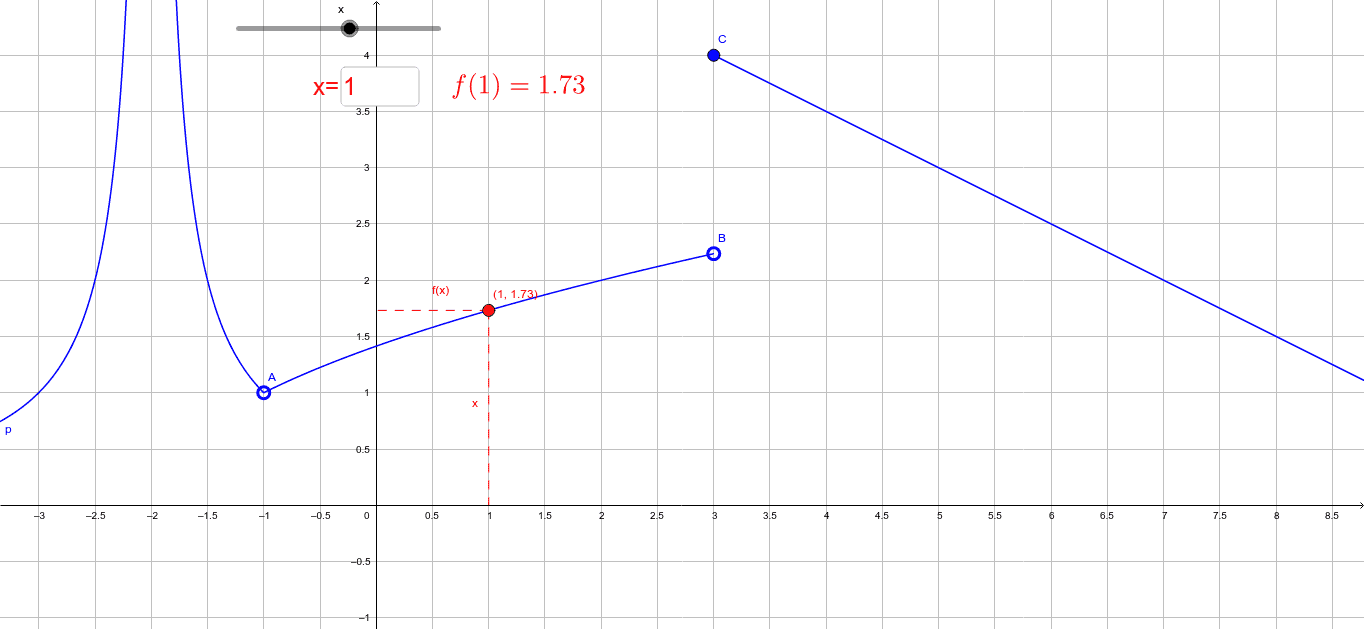
①This GeoGebra example, titled 'Lab 1', is an interactive workspace that combines segments, text fields, and multiple dynamic objects to demonstrate a blend of mathematical concepts including functions, quadrilaterals, planes, logarithmic functions, fractions, and binomial distributions. ②Core mathematical concepts involve limits, properties of quadrilaterals, plane geometry, logarithmic graphs, fraction operations, and probability models of binomial distribution, showcasing an integrated approach to learning. ③Construction highlights: Based on the summary, the example uses the Segment command to create line segments, Textfield for input boxes, and defines objects such as f (function), A, B, C (points), p, a, D, b, c (likely parameters or points), inputBox1 (input field), d (segment or object), and text1 (text label), all forming an interactive experimental environment. ④Target audience: Suitable for high school to early college students, this is ideal for math lab sessions, inquiry-based learning, or teacher demonstrations, allowing learners to manipulate parameters and observe changes in real time.
GeoGebra Commands & Parameters
Segment(D, (a, 0)) → bSegment(D, (0, p(a))) → cTextfield(a) → inputBox1
AI Drawing Prompt Reference
Create an interactive math workspace with an input box for adjusting a parameter. In a coordinate system, place a dynamic point, then draw two perpendicular segments from it: one to a point on the x-axis and another to a point on the y-axis whose height is determined by a function value. Also display the graph of that function, and label the relevant points and segments. The scene should blend function graphing, geometry, and probability concepts for exploratory learning.
The prompt above was compiled from the original drawing commands and is for reference only.