
Journey of a Car and Distance-Time Graphs
Loading the math board and drawing, please wait…
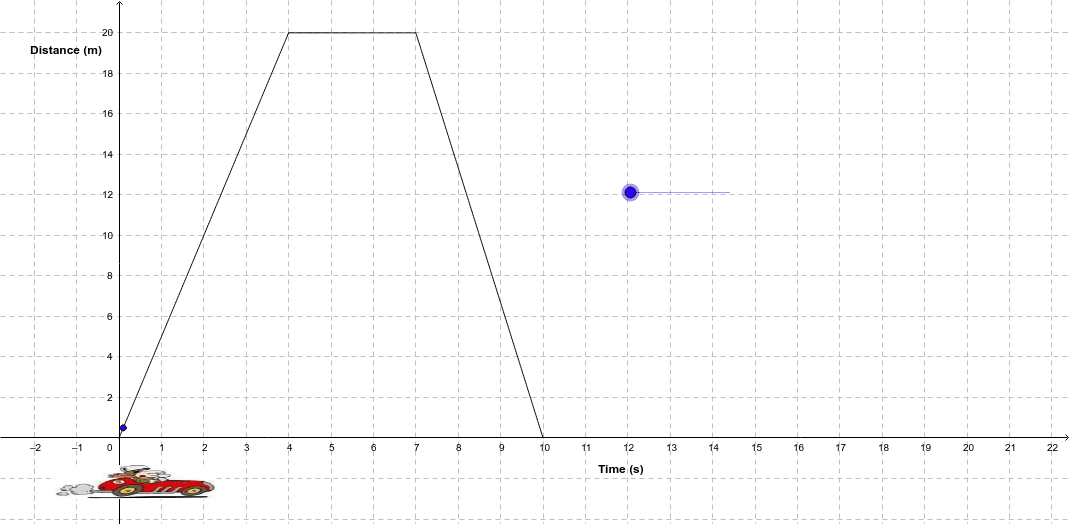
This GeoGebra example demonstrates a piecewise linear distance-time graph modeling a car's journey, illustrating how distance accumulates over time under varying speeds. Core mathematical concepts include piecewise functions, function graphs, coordinate geometry, ratios and fractions, and similar triangles. The construction relies on the GeoGebra Function command and objects such as points A, B, C, D, E, texts text1 and text2, images pic1, pic2, pic3, and function expressions a, b, c, d, f, g, h to assemble the graph and annotations. Suitable for middle and high school mathematics teaching, ideal for classroom demonstrations of uniform and non-uniform motion, the geometric meaning of slope as speed, and dynamic exploration of piecewise function graphs.
GeoGebra Commands & Parameters
Function(-(x(b) / y(b)) * x - z(b) / y(b), 0, 4) → fFunction(-(x(c) / y(c)) * x - z(c) / y(c), 4, 7) → gFunction(-(x(d) / y(d)) * x - z(d) / y(d), 7, 10) → h