
JavaScript Fibonacci Sequence Visualization
Loading the math board and drawing, please wait…
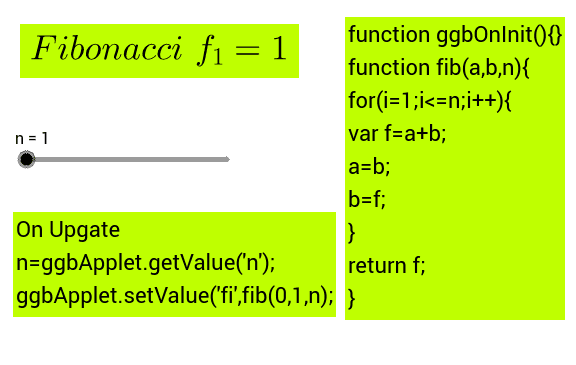
① This GeoGebra example uses JavaScript scripting to dynamically generate and display the first several terms of the Fibonacci sequence, visually showing the recursive growth pattern. ② The core mathematical concept is the Fibonacci sequence, where each term is the sum of the two preceding ones, with extensions to the golden ratio, recurrence relations, and sequence limits. ③ Construction highlights: the summary lists objects n (term index), fi (Fibonacci value), text1, text2, text3 (text displays); JavaScript loops compute values and update text objects, demonstrating dynamic sequence visualization. ④ Suitable for high school and above, useful for teaching sequences, integrating programming with mathematics, and as an introduction to the golden ratio.
GeoGebra Commands & Parameters
Numeric n(1.0)Numeric fi(1.0)