
Is it a Proportion?
Loading the math board and drawing, please wait…
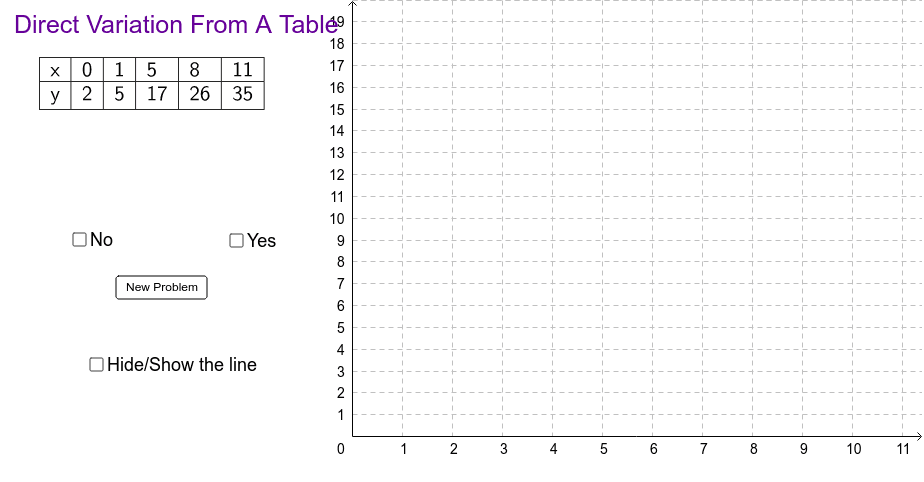
This example demonstrates how to determine if two ratios are proportional through graphical and numerical methods. It involves core math concepts like functions, linear functions, ratios, sequences, and symmetry. Constructed using commands like Random, RandomElement, Append, TableText, If, Sequence, Line in GeoGebra. Suitable for middle school and above, focusing on understanding proportional relationships and function graphs.
GeoGebra Commands & Parameters
Random(1, 2) → nRandom(-5, 5) → A1RandomElement({-2, -1, 0, 0, 0, 0, 1, 2}) → intAppend(x, listx) → list1Append(y, listy) → list2TableText({list1, list2}, "|_") → text1If(int ≟ 0 ∧ b, "Correct") → text2If(int ≟ 0 ∧ a, "Try New Problem") → text3If((int ≠ 0) ∧ a, "Correct") → text4If((int ≠ 0) ∧ b, "Try New Problem") → text5Sequence((Element[listx, n], Element[listy, n]), n, 1, 5, 1) → listpointsLine(Element[listpoints, 1], Element[listpoints, 5]) → c
AI Drawing Prompt Reference
Create a visual representation to demonstrate how to determine if two ratios are proportional using graphical and numerical methods. Start by randomly generating a number n and two points A1, then create two lists, list1 and list2, containing x and y coordinates respectively. Display these coordinates in a table and show different text based on certain conditions. Generate a sequence of points called listpoints and connect the first and last points with a line segment. This illustration helps in understanding the concept of proportional relationships, suitable for educational purposes.
The prompt above was compiled from the original drawing commands and is for reference only.