
Investigating the Mean Value Theorem in Calculus
Loading the math board and drawing, please wait…
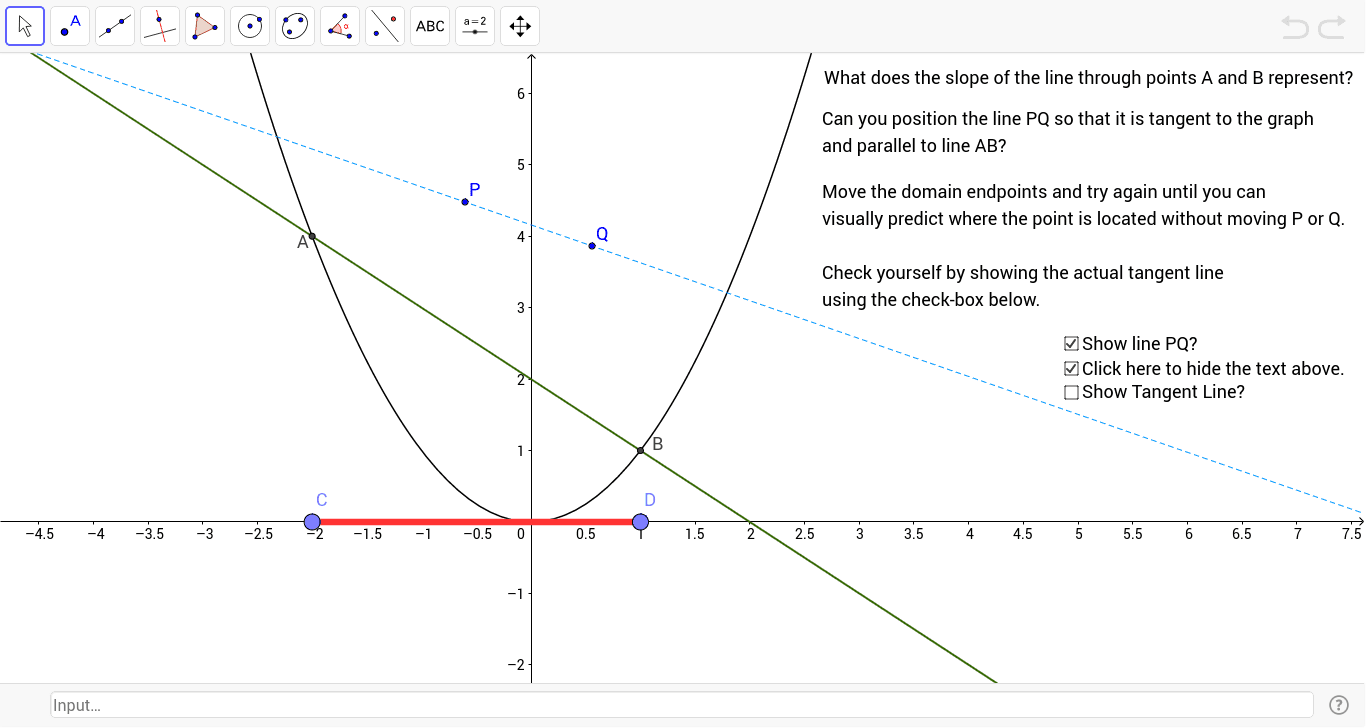
This interactive GeoGebra sketch lets students explore the graphical meaning of the Mean Value Theorem in calculus. It demonstrates that for a smooth (continuous and differentiable) function on a closed interval, there exists at least one interior point where the tangent line is parallel to the secant line connecting the endpoints. The construction uses commands such as Point, OrthogonalLine, Intersect, Line, Slope, Derivative, Root, Tangent, and Segment to build the function f, endpoints A and B, the secant line, the derivative curve, and the tangent line at the candidate point. Sliders and text objects display slopes and coordinates, allowing dynamic manipulation. This resource is ideal for high school or college calculus courses, helping students visualize the theorem's conditions and conclusion, and understand the relationship between average rate of change and instantaneous rate of change.
GeoGebra Commands & Parameters
Point(xAxis) → CPoint(xAxis) → DOrthogonalLine(C, xAxis) → aIntersect(f, a) → AOrthogonalLine(D, xAxis) → bIntersect(f, b) → BLine(A, B) → cSlope(c) → mDerivative(f) → gRoot(h) → e, FOrthogonalLine(e, xAxis) → dIntersect(f, d) → ETangent(E, f) → iSegment(C, D) → jLine(P, Q) → l