
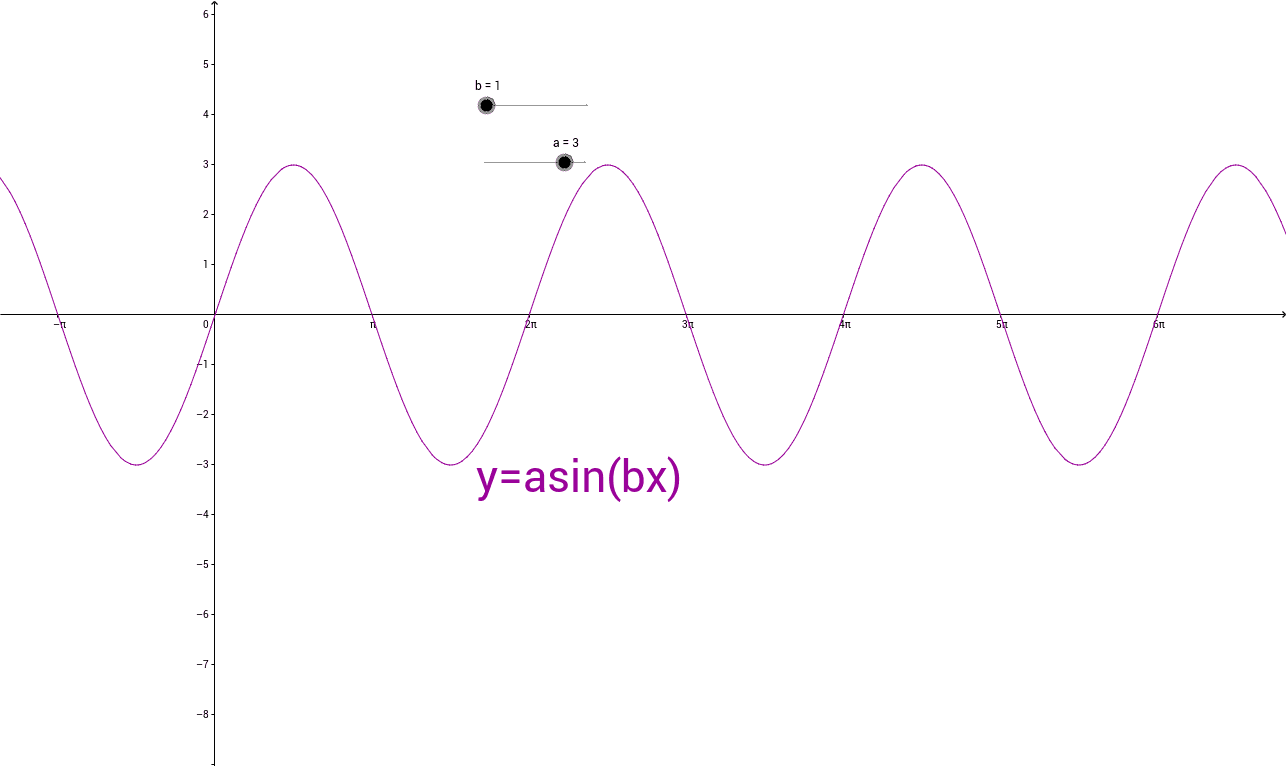
Investigating the Amplitude and Period of y=asin(bx)
Loading the math board and drawing, please wait…
Adjust the values of a and b in the function y=asin(bx) to explore changes in its amplitude and period. This example covers the basic properties of the sine function and how to use GeoGebra's slider animation objects b and a to dynamically display the function graph. Suitable for high school mathematics education and learning.
GeoGebra Commands & Parameters
Numeric b(1.0)Numeric a(3.0)f(x) = a * sin(b * x)