
Investigating Limits Graphically
Loading the math board and drawing, please wait…
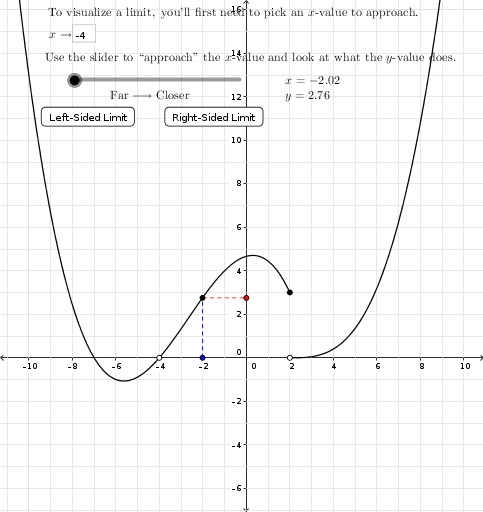
This example visually demonstrates the concept of limits. It involves the limits of functions and uses GeoGebra commands such as OrthogonalLine, Intersect, and Segment to help students understand the geometric meaning of limits. Suitable for high school mathematics education and learning.
GeoGebra Commands & Parameters
OrthogonalLine(C, xAxis) → gIntersect(f, xAxis, (2.000001426350783, 1.4509386138857691E-19)) → BIntersect(f, g, (-2.01626661376711, 2.75515609747587)) → DSegment(C, D) → h_1OrthogonalLine(D, yAxis) → iIntersect(i, yAxis) → ESegment(D, E) → jIntersect(f, xAxis, (-3.9999999995998343, 4.668599581355779E-10)) → GTextfield(x_1) → c