
Investigating Gradient Using a Line Segment
Loading the math board and drawing, please wait…
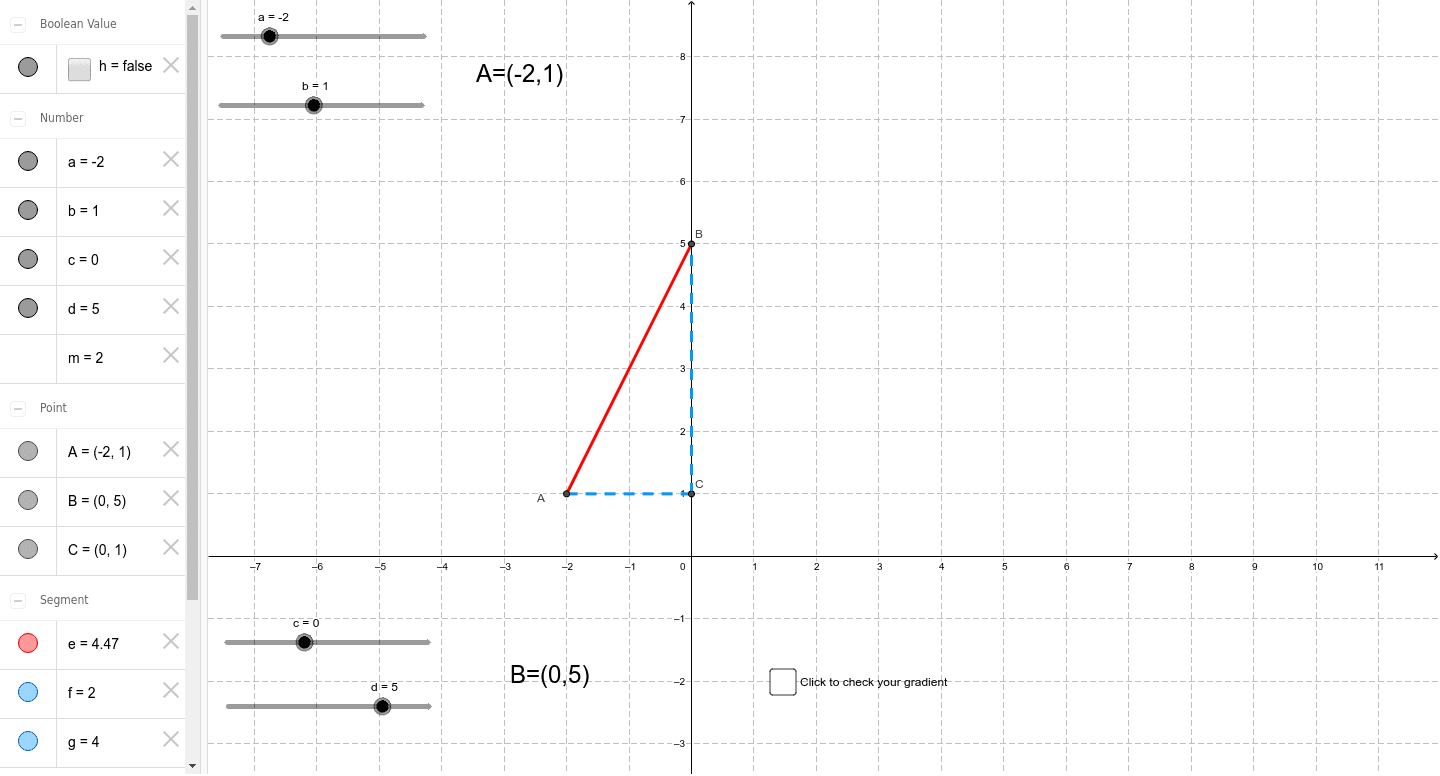
① This example demonstrates the geometric meaning of the gradient (slope) of a line by using a draggable line segment, showing the ratio of vertical change to horizontal change between two points. ② The core mathematical concept is the slope (gradient), involving coordinates of points, segment length and direction, and an intuitive connection to the tangent ratio in a right triangle. ③ Construction details: The GeoGebra command Segment is used to create the line segment, with objects such as points A, B, C, D, E, segments a, b, c, d, e, f, g, and text objects text1, text2, text3 to label coordinates and slope values; auxiliary line m and perpendicular foot h may be included to dynamically display the slope change. ④ Suitable for upper middle school or early high school students, this interactive tool helps learners understand the definition of slope in linear functions and serves as an introductory demonstration in coordinate geometry.
GeoGebra Commands & Parameters
Segment(A, B) → eSegment(A, C) → fSegment(C, B) → g
AI Drawing Prompt Reference
Draw a coordinate plane with a draggable line segment between two points. Connect one point to the other and to a point directly below or above it to form a right triangle, with one horizontal and one vertical leg. Label the coordinates of the two endpoints)Skip, and display the ratio of the vertical leg to the horizontal leg as the slope. Include a horizontal reference line to help visualize the slope change.
The prompt above was compiled from the original drawing commands and is for reference only.