
Investigate Correlation and PMCC
Loading the math board and drawing, please wait…
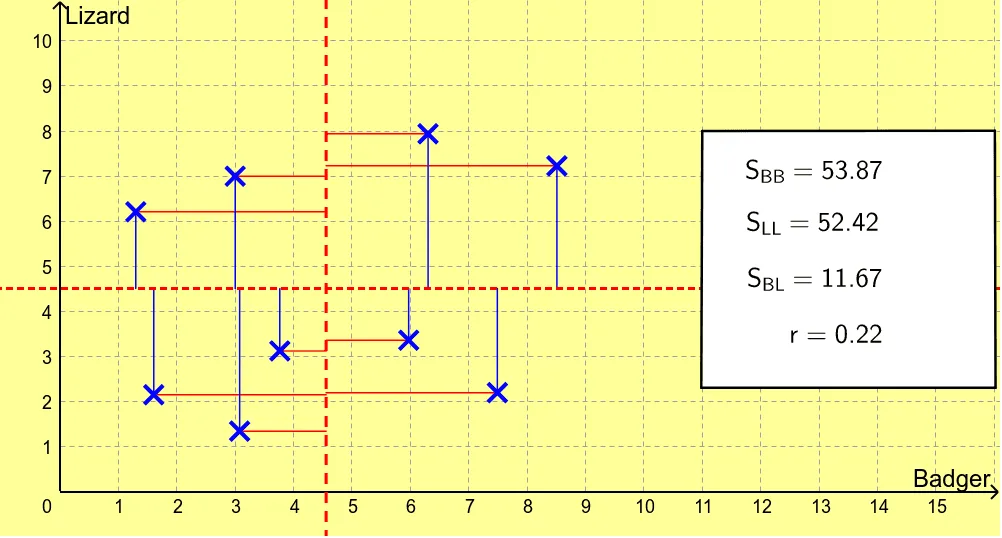
This GeoGebra applet is designed to investigate correlation and the Pearson's correlation coefficient. By adjusting the position of data points, one can observe the linear relationship and its strength between the data. Key mathematical concepts include correlation and the Pearson's correlation coefficient. The construction involves the use of Polygon, Sequence, Mean, and Sum commands. Suitable for high school students and teachers.
GeoGebra Commands & Parameters
Polygon(J, K, L, M) → poly1, j, k, l, m_1Sequence(x(Element[Q, i]), i, 1, 9) → xsSequence(y(Element[Q, i]), i, 1, 9) → ysMean(xs) → xbarMean(ys) → ybarSequence(Segment[(Element[xs, i], Element[ys, i]), (xbar, Element[ys, i])], i, 1, 9) → vertsSequence(Segment[(Element[xs, i], Element[ys, i]), (Element[xs, i], ybar)], i, 1, 9) → horzSum(Sequence[(Element[xs, i] - xbar)^(2), i, 1, 9]) → sxxSum(Sequence[(Element[ys, i] - ybar)^(2), i, 1, 9]) → syySum(Sequence[((Element[xs, i] - xbar) * (Element[ys, i] - ybar)), i, 1, 9]) → sxy
AI Drawing Prompt Reference
Draw a scatter plot with adjustable data points, showing lines connecting each point to its mean, as well as auxiliary shapes representing the sum of squares and products for calculating the correlation coefficient, illustrating the distribution and relationship of data points relative to their mean.
The prompt above was compiled from the original drawing commands and is for reference only.