
Inverse Sine Function Demo
Loading the math board and drawing, please wait…
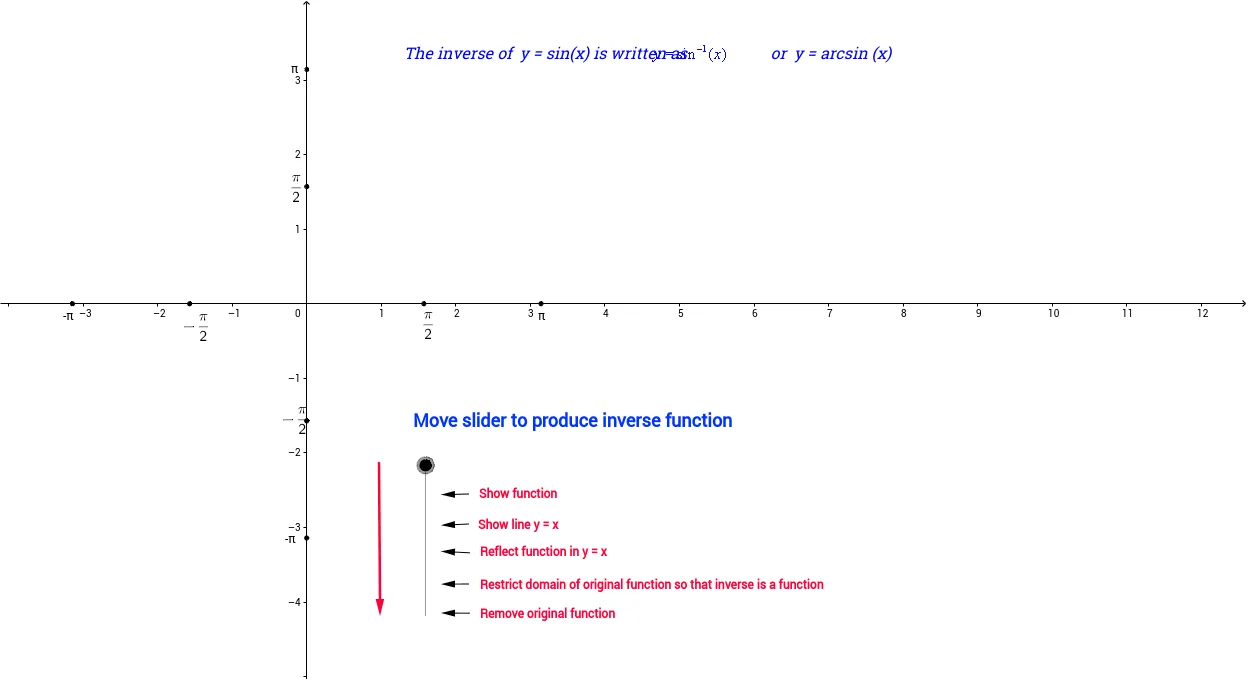
This example demonstrates the graph and properties of the inverse sine function, involving core concepts like trigonometry, inverse functions, inequalities, and coordinate geometry. It uses GeoGebra commands such as Vector, Function, and Slider Animation for construction, suitable for high school mathematics teaching and function graph learning.
GeoGebra Commands & Parameters
Vector(I, J) → uVector(K, L) → vVector(M, N) → wVector(O, P) → zVector(Q, R) → cVector(S, T) → dFunction(g, -1.5707963267948966, 1.5707963267948966) → p
AI Drawing Prompt Reference
Draw a demonstration of the inverse sine function. Start with a unit circle and coordinate axes, marking key points. From the origin, draw five vectors pointing to specific positions on the circle or axes to represent the correspondence between angles and sine values. Finally, plot the principal branch of the inverse sine function on the coordinate plane, with domain from negative pi over two to positive pi over two and range from negative one to one, as a smooth, monotonically increasing curve. Clearly label the axes, the curve, and the relationship between the vectors and the function to illustrate the geometric meaning of trigonometric and inverse functions.
The prompt above was compiled from the original drawing commands and is for reference only.