
Intuitive Concept of Limits
Loading the math board and drawing, please wait…
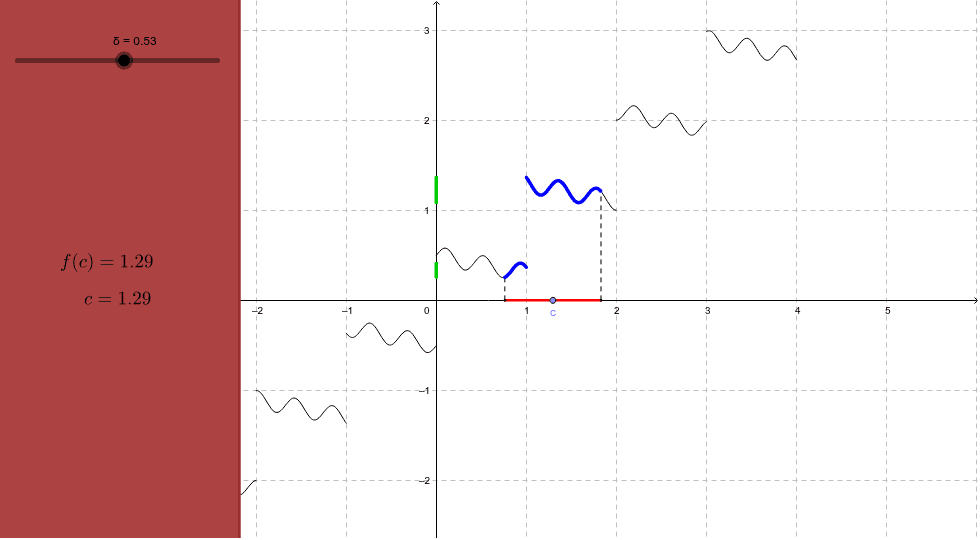
This example dynamically demonstrates the intuitive concept of limits, showing how the function value changes as the independent variable approaches a certain point. It involves core mathematical concepts including limits, triangles, perimeter, bar charts, area, and binomial distribution. The construction highlights GeoGebra commands such as Point, Segment, Locus, Function, and CreatePanel. Suitable for high school students and calculus beginners.
GeoGebra Commands & Parameters
Point(xAxis) → ASegment(L, R) → δsegSegment(L, (a, f(a))) → dashLeftSegment(R, (b, f(b))) → dashRightPoint(Segment[L, R]) → PLocus(Q, P) → rangeFunction(f, a, b) → gCreatePanel(240) → poly1, d
AI Drawing Prompt Reference
Draw a function graph showing how the function value changes as the independent variable approaches a certain point. Start by marking a point A on the x-axis, then place points P and Q on either side of A. Draw line segments from A to P and from A to Q, and then draw segments from P to f(a) and from Q to f(b). Next, draw the locus of point P to form a range. Finally, draw the function f over the interval [a, b].
The prompt above was compiled from the original drawing commands and is for reference only.