
Introducing the Derivative: Tangent Lines and Rate of Change
Loading the math board and drawing, please wait…
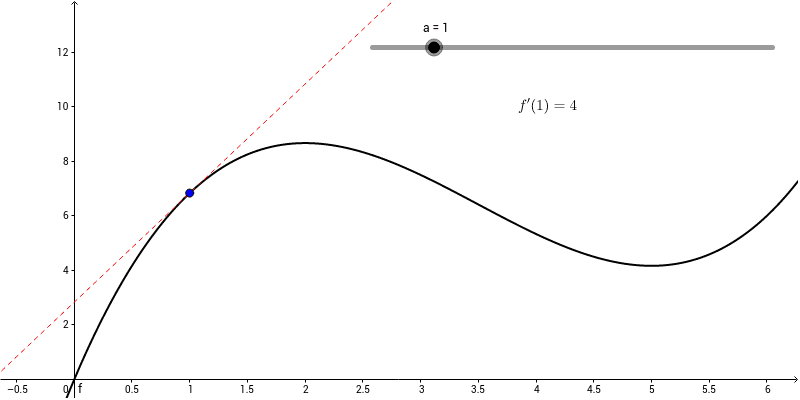
This GeoGebra example introduces the derivative by showing how a tangent line to a function graph changes as the point of tangency moves. It connects the geometric idea of a tangent line with the analytic concept of instantaneous rate of change, slope, and local linear approximation. The construction uses the function object f, a parameter a to control the point A on the curve, and the Tangent command to draw the tangent at A; objects b and c may support the tangent equation or auxiliary labels, while text1 provides explanatory text. It is suitable for high school calculus, introductory college calculus, or classroom demonstrations where students need to move from visual intuition to the formal definition of the derivative.
GeoGebra Commands & Parameters
Tangent(A, f) → c
AI Drawing Prompt Reference
Draw a function graph and a tangent line that changes as the point of tangency moves. The tangent line starts from a point on the graph and shows how it changes as the point moves. The relationship between the graph and the tangent line helps understand the concept of the tangent line.
The prompt above was compiled from the original drawing commands and is for reference only.