
Interactive Practice on Function Graphs and Linear Equations
Loading the math board and drawing, please wait…
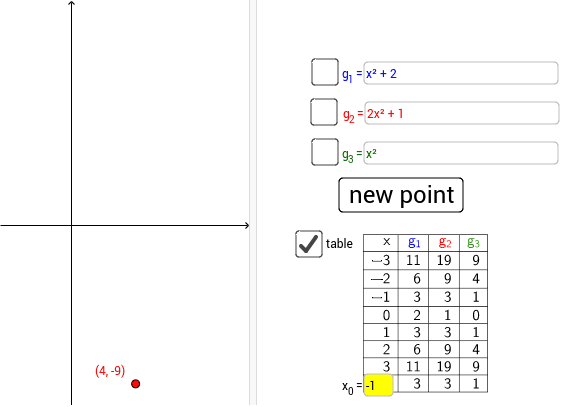
This example demonstrates the intersection of function graphs and linear equations, matrix operations, and the median line through interactive GeoGebra constructions. It involves core math concepts like graphing, linear equations, matrices, median line properties, similar triangles, and symmetry. Constructed using commands like Random, RandomElement, Textfield, and TableText for dynamic parameter generation and table display, it is suitable for high school mathematics education in exploring function, equation, and geometric synthesis applications.
GeoGebra Commands & Parameters
Random(-10, 10) → aRandom(-10, 10) → bRandomElement({-5, -4, -3, -2, -1, 1, 2, 3, 4, 5}) → cTextfield(h) → InputBox1RandomElement({-5, -4, -3, -2, -1, 1, 2, 3, 4, 5}) → a_1Random(-10, 10) → b_1RandomElement({-5, -4, -3, -2, -1, 1, 2, 3, 4, 5}) → c_1Random(-10, 10) → d_1Textfield(m) → InputBox2Textfield(g) → InputBox3Textfield(f) → InputBox4TableText({{A1_1, B_1, C_1, D_1}, {-3, g(-3), h(-3), f(-3)}, {-2, g(-2), h(-2), f(-2)}, {-1, g(-1), h(-1), f(-1)}, {0, g(0), h(0), f(0)}, {1, g(1), h(1), f(1)}, {2, g(2), h(2), f(2)}, {3, g(3), h(3), f(3)}, {1, e, l, k}}, "|_r") → text3_1