
Interactive Practice Activity on Mean, Median and Mode
Loading the math board and drawing, please wait…
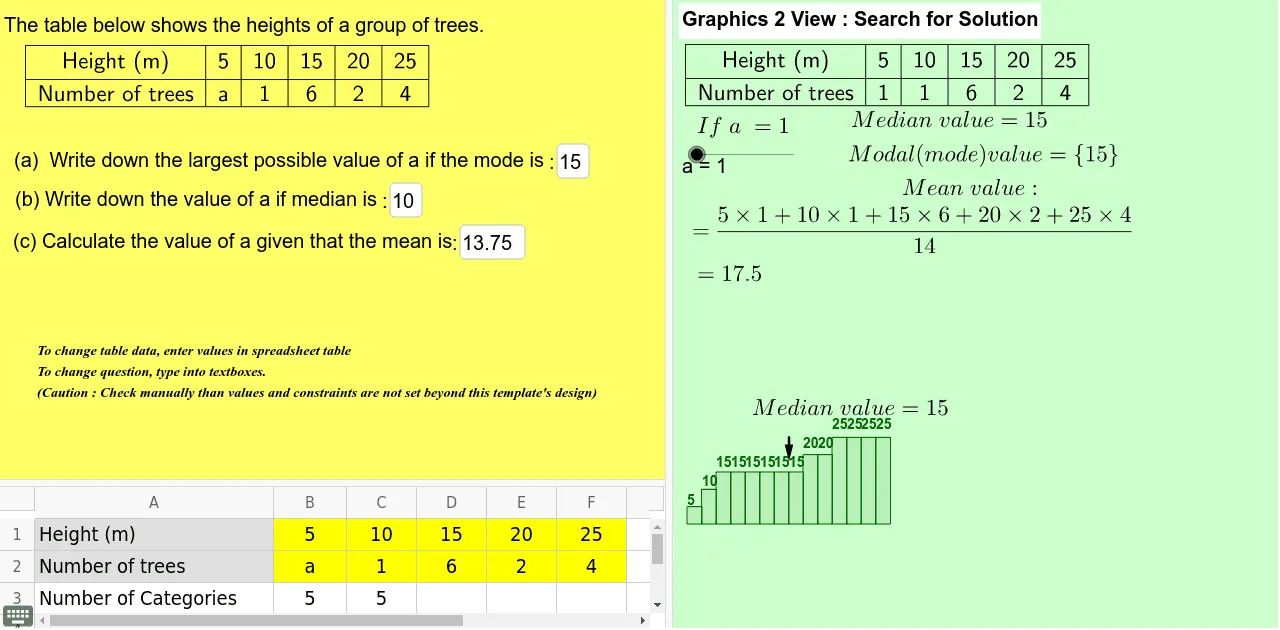
This GeoGebra applet demonstrates how to compute the mean, median, and mode from a frequency table with 5 categories, where one frequency is left unknown. Users can adjust the unknown frequency via input boxes and instantly see how the three measures of central tendency change. The core mathematical concepts are descriptive statistics: mean (arithmetic average), median (middle value after sorting), and mode (most frequent value). The construction uses GeoGebra commands such as Sequence, RemoveUndefined, Insert, Join, Textfield, Median, TableText, Sum, Mean, Mode, and Vector to build dynamic lists and tables. Interactive elements include input boxes (inputBox1-3) and text objects for questions and notes. This activity is suitable for middle or high school statistics lessons, allowing students to explore the sensitivity of these measures to data changes in a hands-on way.
GeoGebra Commands & Parameters
Sequence(Cell[i + 1, 1], i, 1, B3) → ListCategoryValuesSequence(Cell[i + 1, 2], i, 1, B3) → ListFrequencyValuesFromCellsRemoveUndefined(ListFrequencyValuesFromCells) → ListFrequencyValuesRemovedUndefinedInsert(a, ListFrequencyValuesRemovedUndefined, B4) → ListFrequencyValueswithVariableInsert("a", ListFrequencyValuesRemovedUndefined, B4) → ListFrequencyValueswithTextJoin({ListCategoryTitle, ListCategoryValues}) → ListCategoryTextfield(targetmode) → inputBox1Textfield(targetmedian) → inputBox2Textfield(targetmean) → inputBox3Median(Take[ListCategory, 2, 5], Take[ListFrequencyNum, 2, 5]) → medianvalue1Join({ListFrequencyTitle, ListFrequencyValueswithText}) → ListFrequencyVariableTextTableText({ListCategory, ListFrequencyNum}, "c|_") → Table2SolutionTableText({ListCategory, ListFrequencyVariableText}, "c|_") → Table1ProblemJoin({ListFrequencyTitle, ListFrequencyValueswithVariable}) → ListFrequencyVariableSearchTableText({ListCategory, ListFrequencyVariableSearch}, "c|_") → Table3HiddenSearchSum(Take[ListFrequencyVariableSearch, 2]) → totalfrequencyMedian(Take[ListCategory, 2, numberofcategories + 1], Take[ListFrequencyVariableSearch, 2, numberofcategories + 1]) → medianvaluesearchSequence(If[i < numberofcategories, "+", ""], i, 1, numberofcategories) → ListAddSignSequence(Element[ListCategoryValues, i] + "×" + (Element[ListFrequencyValueswithVariable, i] + Element[ListAddSign, i]), i, 1, numberofcategories) → CategoryFrequencyProductListSequence(Element[MatrixAllSortedSearch, 1, i], i, 1, totalfrequency) → ListAllSortedSearchSequence(Polygon[(i - 1, 0), (i, 0), (i, Element[ListAllSortedSearch, i]), (i - 1, Element[ListAllSortedSearch, i])], i, 1, totalfrequency) → DataVisualBarSequence(Text[Element[ListAllSortedSearch, i], (i - 1, Element[ListAllSortedSearch * 1.1, i])], i, 1, totalfrequency) → DataVisualTextMean(Take[ListCategory, 2, numberofcategories + 1], Take[ListFrequencyVariableSearch, 2, numberofcategories + 1]) → meanvaluesearchMode(ListAllSortedSearch) → modesearchVector(((2 * medianposition - 1) / 2, Element[ListAllSortedSearch, totalfrequency]), ((2 * medianposition - 1) / 2, Max[Element[ListAllSortedSearch, totalfrequency] * 0.5, Element[ListAllSortedSearch, medianposition] * 1.2])) → medianpositionpointerSum(CategoryFrequencyProductList) → TextSumCategoryFrequency