
Interactive Parametric Equation Graphing
Loading the math board and drawing, please wait…
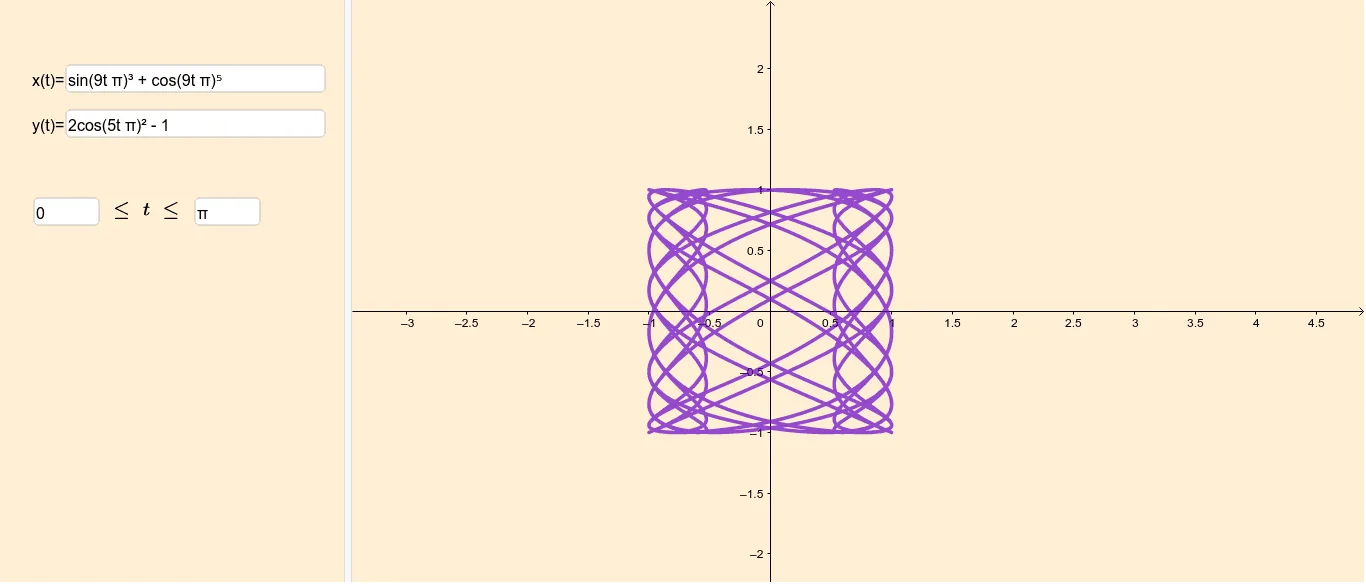
This GeoGebra example demonstrates how to plot parametric curves and dynamically adjust parameters using text input boxes, allowing real-time observation of curve shape changes. The core mathematical concept is parametric equations, where x and y coordinates are expressed as functions of a parameter t, enabling representation of curves such as circles, ellipses, and cycloids. Construction highlights include using the CurveCartesian command to define the parametric curve, Textfield and InputBox objects for parameter entry, and variables a, b, c to control coefficients. This resource is suitable for high school or early college students learning about parametric equations and function graphing, as well as for teachers demonstrating the effect of parameter variation on curve geometry, fostering interactive and visual understanding.
GeoGebra Commands & Parameters
Textfield(f) → InputBox1Textfield(g) → InputBox2Textfield(b) → InputBox4Textfield(a) → InputBox3CurveCartesian(f(t), g(t), t, a, b) → c
AI Drawing Prompt Reference
Create a graph of a parametric curve with input boxes for functions f and g defining the curve, and sliders to adjust the range of parameter t and coefficients a and b, observing how the curve shape changes dynamically with parameter variations.
The prompt above was compiled from the original drawing commands and is for reference only.