
Interactive Parabola Graphing and Transformation
Loading the math board and drawing, please wait…
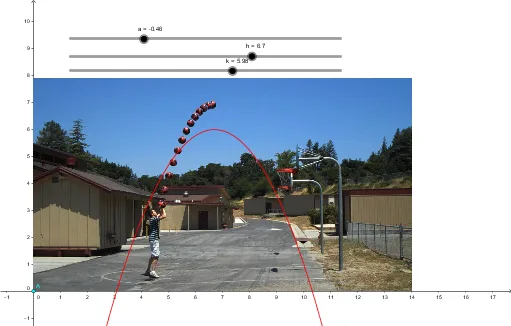
This GeoGebra example demonstrates the dynamic graph of a parabola and its intersection relationships within the Cartesian coordinate system. The core mathematical concepts include quadratic functions, curve sketching, continuity, dilation, and natural-number parameter control. Constructed using the GeoGebra Intersect command on objects A, B, curve a, parameters h, k, c, and image object pic1, the applet allows interactive adjustment of the parabola through translation and scaling. It is designed for high school mathematics teaching, especially function graphing and analytic geometry, and supports classroom demonstrations or independent student exploration of quadratic function properties.
GeoGebra Commands & Parameters
Intersect(xAxis, yAxis) → A