
Interactive Fraction Addition Practice with Number Line Visualization
Loading the math board and drawing, please wait…
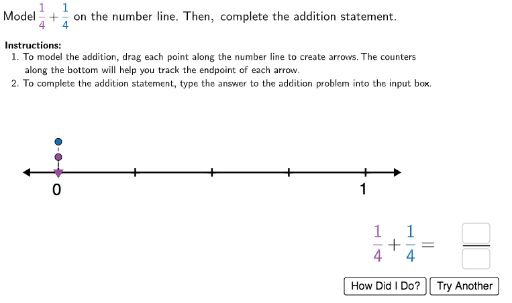
This GeoGebra example is an interactive drill for adding fractions, designed to help students visualize the process on a number line. It demonstrates how two fractions (with different denominators) are combined, emphasizing common denominators, simplification, and equivalence. The construction uses commands such as Point, Segment, Random, LaTeX, Sequence, Textfield, Element, Midpoint, and Vector to generate random problems, display them with LaTeX, create a number line with ticks, and place fraction values dynamically. Objects like InputBox, CheckMark, and Solution provide immediate feedback. Suitable for upper elementary to middle school learners, this tool supports classroom practice and self-study, reinforcing fraction arithmetic through visual and interactive means.
GeoGebra Commands & Parameters
Point(point2height) → Num2PointSegment(StartPoint, EndPoint) → NumberLineRandom(-15, -1) → negintRandom(1, 15) → posintLaTeX(Text["\checkmark"]) → RightCheckLaTeX(Text["×"]) → WrongCheckSequence((i, 0), i, -30, 30, 1) → SmallTicksTextfield(inputnum) → InputBox1Point(point1height) → Num1PointElement(UnitsList, den - 2) → unitsSequence((i, 0), i, x(StartPoint) + 0.1, x(EndPoint) - 0.1, 1 / studentden) → TicksTextfield(inputden) → InputBox2Midpoint((0, -0.08), Num1Point) → num1labelpositionMidpoint((x(Num1Point), -0.16), Num2Point) → num2labelpositionSequence(Text["\dfrac{" + ((i * studentden)) + "}{" + studentden + "}", (i - 0.02, 0.11), true, true], i, x(StartPoint) + 0.1 + 1 / studentden, x(EndPoint) - 0.1 - 1 / studentden, 1 / studentden) → scaleSegment((1.3179688433266583, -0.23882702772215378), (1.4034488433266583, -0.23882702772215378)) → fraclineLaTeX(Text[num]) → correctnumVector((0, 0.05), (x(Num1Point), 0.05)) → negvectorVector((x(Num1Point), 0.1), (x(Num2Point), 0.1)) → posvectorSegment(Origin, (0, 0.05)) → connect1Segment((x(Num1Point), 0.05), (x(Num1Point), 0)) → connect2Segment((x(Num2Point), 0.1), Solution) → connect3LaTeX(Text["\dfrac{" + position1 + "}{" + studentden + "}"]) → H1DisplayLaTeX(Text["\dfrac{" + position2 + "}{" + studentden + "}"]) → H2Display
AI Drawing Prompt Reference
Draw a horizontal number line from -30 to 30 with small tick marks. Above the line, place two points representing two fractions (one negative, one positive), and connect them with arrow vectors to show the addition process. Below the line, put two input boxes for numerator and denominator, with a checkmark and a cross for feedback. Above the line, label the scale with fraction values (like a/b) at tick positions, and use segments and vectors between the two fraction points to highlight the sum. The layout should be clean and educational.
The prompt above was compiled from the original drawing commands and is for reference only.