
Interactive Demonstration of Sine Transformations
Loading the math board and drawing, please wait…
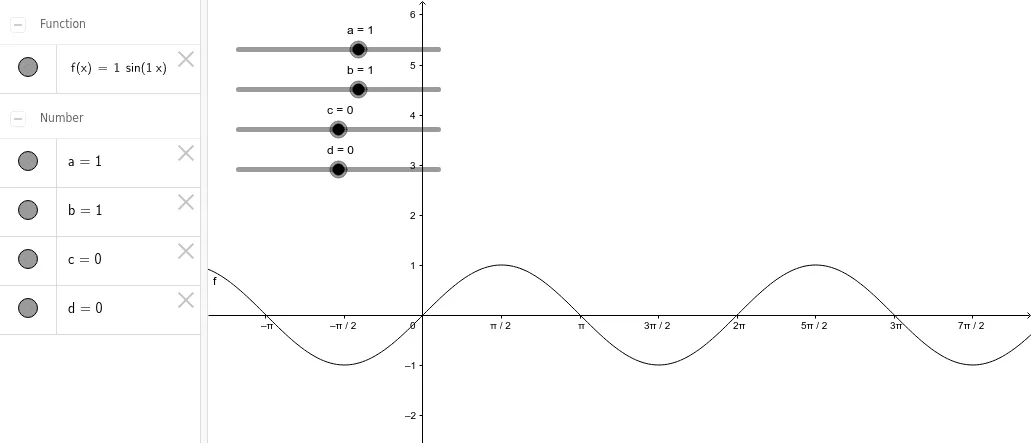
This GeoGebra example dynamically illustrates transformations of the sine function y = a·sin(bx + c) + d, showing how amplitude, period, phase shift, and vertical shift alter the graph. Core mathematical concepts include trigonometric function transformations and parameter effects on sinusoidal curves. Construction highlights: parameters a, b, c, d are defined via sliders or input boxes; the function f(x) = a*sin(b*x + c) + d is plotted using the function command; auxiliary elements such as triangles, tangent lines, or parabolas may be included for comparison. Suitable for high school or introductory college students learning trigonometric graph properties, and useful for teacher demonstrations or student-led exploration of parameter changes.
GeoGebra Commands & Parameters
Numeric a(1.0)Numeric b(1.0)Numeric c(0.0)Numeric d(0.0)f(x) = (a * sin((b * x) - c)) + d
AI Drawing Prompt Reference
Draw a dynamic sine function graph y = a·sin(bx + c) + d, where a, b, c, and d are adjustable parameters. First set the parameters a, b, c, and d, then plot the function f(x) = a*sin(b*x + c) + d. Observe how the graph changes by adjusting the parameters, including amplitude, period, phase shift, and vertical shift.
The prompt above was compiled from the original drawing commands and is for reference only.