
Interactive Demonstration of Kite Geometry and Poisson Distribution
Loading the math board and drawing, please wait…
In collections
LINEAR FUNCTIONS
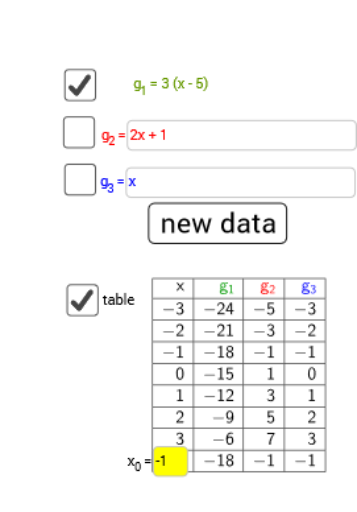
This example interactively demonstrates the geometric transformation of a kite shape alongside the randomness of the Poisson distribution. It involves core math concepts like similarity transformation, functions, sequences, and Poisson distribution. Constructed using commands like Random, RandomElement, Textfield, TableText, Slider, Locus, and Graphing in GeoGebra. Suitable for high school and above, helping students visualize the connection between geometric transformations and probability statistics.
GeoGebra Commands & Parameters
Random(-10, 10) → aRandomElement({-5, -4, -3, -2, -1, 1, 2, 3, 4, 5}) → a_1RandomElement({-5, -4, -3, -2, -1, 1, 2, 3, 4, 5}) → cRandom(-10, 10) → bTextfield(h) → InputBox1Random(-10, 10) → b_1RandomElement({-5, -4, -3, -2, -1, 1, 2, 3, 4, 5}) → c_1Random(-10, 10) → d_1Textfield(m) → InputBox2Textfield(f) → InputBox4Random(-10, 10) → d_2TableText({{A1_1, B_1, C_1, D_1}, {-3, g(-3), h(-3), f(-3)}, {-2, g(-2), h(-2), f(-2)}, {-1, g(-1), h(-1), f(-1)}, {0, g(0), h(0), f(0)}, {1, g(1), h(1), f(1)}, {2, g(2), h(2), f(2)}, {3, g(3), h(3), f(3)}, {1, e, l, k}}, "|_r") → text3_1
AI Drawing Prompt Reference
Draw a kite shape and demonstrate its similarity transformation. Simultaneously, display the randomness of the Poisson distribution beside it in a table, showing function values for three columns where the first column is integers and the other two correspond to the functions of the kite's vertices. Use sliders to control transformation parameters and text boxes for function names. The layout should highlight the connection between geometric transformations and probability statistics.
The prompt above was compiled from the original drawing commands and is for reference only.