
Interactive Demonstration of 'Between-ness' in Addition and Subtraction
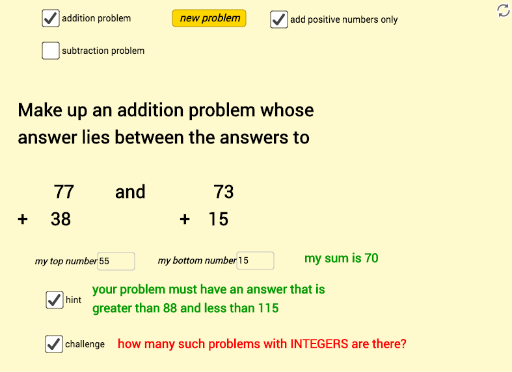
Loading the math board and drawing, please wait…
① This example uses randomly generated numbers and interactive input boxes to visually show how the sum or difference of two numbers lies 'between' the minimum and maximum possible values, helping students understand intervals and boundaries in addition and subtraction. ② Core mathematical concepts include properties of addition and subtraction, maximum and minimum (Max/Min), random number generation, and inequality relations, with preliminary ideas of combinatorics and confidence intervals. ③ Construction highlights: GeoGebra commands such as Random, Max, Min, and Textfield are used; objects include buttons (button1, button2), input boxes (InputBox1, InputBox2), text objects (text1 to text7), and numeric variables (a, b, c, d, e, f, g, h, i, j) storing values; mySum and myDiff represent the sum and difference, while minSum, maxSum, minDiff, maxDiff define the bounds. ④ Suitable for upper elementary to middle school students, this interactive tool is ideal for classroom activities or self-paced exploration, and serves as a teacher demonstration aid to build intuitive understanding of result ranges in arithmetic operations.
GeoGebra Commands & Parameters
Random(bottom, 99) → bRandom(bottom, 99) → aMax(a, b) → T1Min(a, b) → B1Random(bottom, 99) → cRandom(bottom, 99) → dMax(c, d) → T2Min(c, d) → B2Min(A1, A2) → minSumMax(A1, A2) → maxSumMin(S1, S2) → minDiffMax(S1, S2) → maxDiffTextfield(myT) → InputBox1Textfield(myB) → InputBox2
AI Drawing Prompt Reference
Create an interactive math demonstration showing the range of sums and differences of two random numbers. Include two input boxes for entering numbers, two buttons to regenerate random values, and displayed values for the two numbers, their sum, difference, and the minimum and maximum possible sums and differences. Highlight the sum and difference with colored text or arrows indicating they lie between the bounds. Keep the layout clean and educational.
The prompt above was compiled from the original drawing commands and is for reference only.