
Integral with Partial Fractions: Visualizing the Integration Process
Loading the math board and drawing, please wait…
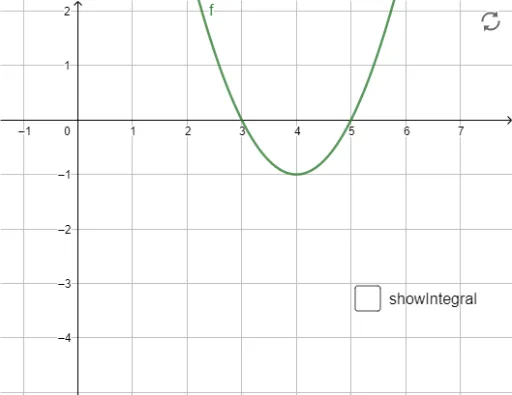
This GeoGebra example demonstrates how to evaluate a definite integral of a rational function using partial fraction decomposition, while visually showing the integration area and numerical result. The core mathematical concepts include rational functions, partial fractions, definite integrals, and the geometric meaning of integration limits. Construction highlights: the Integral command computes the definite integral, NIntegral provides numerical verification, Point marks the interval endpoints, and parameters f, g, a, A, B, b control the function and integration bounds, with showIntegral toggling the shaded region. Suitable for advanced high school or college calculus students learning integration techniques and numerical verification, as well as for teachers demonstrating the practical use of partial fractions in class.
GeoGebra Commands & Parameters
Integral(g, 0, 2) → aPoint(xAxis) → APoint(xAxis) → BNIntegral(g, x(A), x(B)) → b
AI Drawing Prompt Reference
Draw a coordinate plane with a rational function curve. Shade the area under the curve between x=0 and x=2 to represent the definite integral. Place two movable points on the x-axis to mark the integration interval endpoints, and display the numerical integral value for that interval. Clearly fill the region between the curve and the x-axis, and label the integration limits and result to illustrate the geometric meaning of partial fraction integration.
The prompt above was compiled from the original drawing commands and is for reference only.