
Integer Addition and Subtraction Graphically
Loading the math board and drawing, please wait…
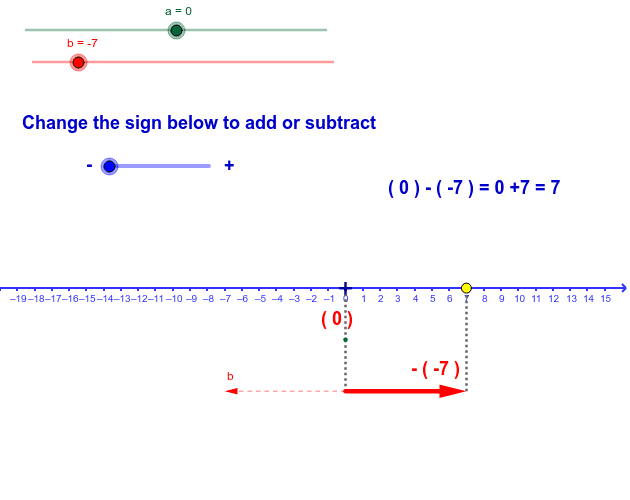
This example demonstrates the addition and subtraction of integers through graphical methods. It involves core mathematical concepts such as integer operations, vectors, and geometric transformations. The construction utilizes GeoGebra commands like Line, Vector, OrthogonalLine, Intersect, Segment, Mirror, Midpoint, and If. It is suitable for middle school and above students to understand the geometric interpretation of integer operations, enhancing intuitive comprehension.
GeoGebra Commands & Parameters
Line(C, xAxis) → dVector(B, D) → uVector(C, E) → vOrthogonalLine(E, xAxis) → eIntersect(e, xAxis) → FSegment(E, F) → fSegment(D, C) → gSegment(A, B) → hMirror(E, C) → E'Vector(C, E') → wMidpoint(E, C) → GMidpoint(D, B) → HIf(signo < 0, "-", "+") → TextoSignoIf(a > 0, "+", " ") → TextoSignoaIf(b > 0, "+", " ") → TextoSignobIf(b2 ≥ 0, "+", " ") → TextoSignob2
AI Drawing Prompt Reference
Draw a graph showing integer addition and subtraction, including a horizontal axis and two vectors, with perpendicular lines, intersections, segments, and reflections to represent addition and subtraction operations, labeled with signs, start with the basic coordinate axis and vectors, then construct perpendicular lines and intersections, draw segments and reflections, finally label the signs.
The prompt above was compiled from the original drawing commands and is for reference only.