
Inequality Demonstration by Ricardo García Mesa
Loading the math board and drawing, please wait…
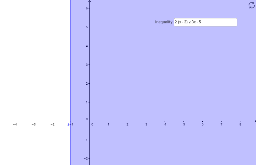
This example illustrates the graphical representation and variation patterns of inequalities. It involves core mathematical concepts such as inequalities, fractal geometry, circles, limits, scalene triangles, and spheres. The construction utilizes GeoGebra commands like Textfield and CasillaDeEntrada1 for interactive variable manipulation. Suitable for high school and above, it helps learners understand the relationship between inequalities and geometric shapes, as well as dynamic changes.
GeoGebra Commands & Parameters
Textfield(a) → CasillaDeEntrada1
AI Drawing Prompt Reference
Create a visual demonstration of inequality representation and variation patterns involving circles, scalene triangles, and inequality symbols, showing their dynamic relationships and geometric construction, suitable for high school and above, with interactive variable manipulation through text input to observe changes in the relationship between inequalities and geometric shapes.
The prompt above was compiled from the original drawing commands and is for reference only.