
Inequalities: Focusing on Change – Tangent, Secant, and Parabola
Loading the math board and drawing, please wait…
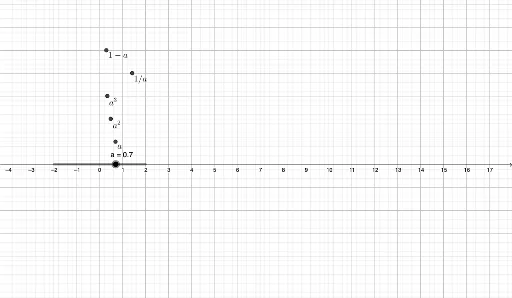
This interactive GeoGebra example dynamically illustrates how inequalities relate to change, focusing on the geometric interplay among a parabola, tangent lines, secant lines, and the tangent function. The core mathematical concepts include inequalities, function graphing, tangent slope, secant slope, and the fundamental idea of rate of change in calculus. Constructed using objects a, A, B, C, D, E, and multiple text labels (text1–text5), the applet links moving points to show how the inequality between function values, tangent slopes, and secant slopes evolves as the independent variable changes. It is suitable for high school and early college students learning inequalities in function analysis, and serves as an intuitive visual aid for introducing derivatives in calculus, helping learners grasp the essence of change and inequality constraints from a geometric perspective.
GeoGebra Commands & Parameters
Numeric a(0.7)(a, 1)(a^(2), 2)(a^(3), 3)(1 / a, 4)(1 - a, 5)
AI Drawing Prompt Reference
Create a dynamic geometric diagram illustrating inequalities related to rates of change. Include a parabola, a tangent line, and a secant line passing through a movable point on the parabola. Also show a tangent function curve as a reference. Use multiple text labels to display function values, tangent slope, secant slope, and their inequality relationships. As the point moves along the parabola, these values and inequalities update in real time, visually demonstrating the constraints among function value, tangent slope, and secant slope. The layout should be clear, suitable for teaching calculus concepts like derivatives and inequality analysis.
The prompt above was compiled from the original drawing commands and is for reference only.