
Inequalities and Geometric Shapes Comprehensive Demo
Loading the math board and drawing, please wait…
①This GeoGebra example demonstrates a comprehensive visualization combining inequalities, fractions, circles, quadrilaterals, ratios, and binomial distribution.②Core mathematical concepts include inequality regions, fraction and ratio operations, geometric properties of circles and quadrilaterals, and probability characteristics of binomial distribution.③Construction highlights: from the summary, only objects a and b are defined, likely serving as parameters or variables to dynamically control inequality regions or geometric shapes, showcasing flexible use of GeoGebra objects and commands.④Suitable for secondary school mathematics, this example aids in cross-topic integrated review, helping students intuitively grasp connections among algebra, geometry, and probability, and serves as a reference for teachers creating interactive lessons.
GeoGebra Commands & Parameters
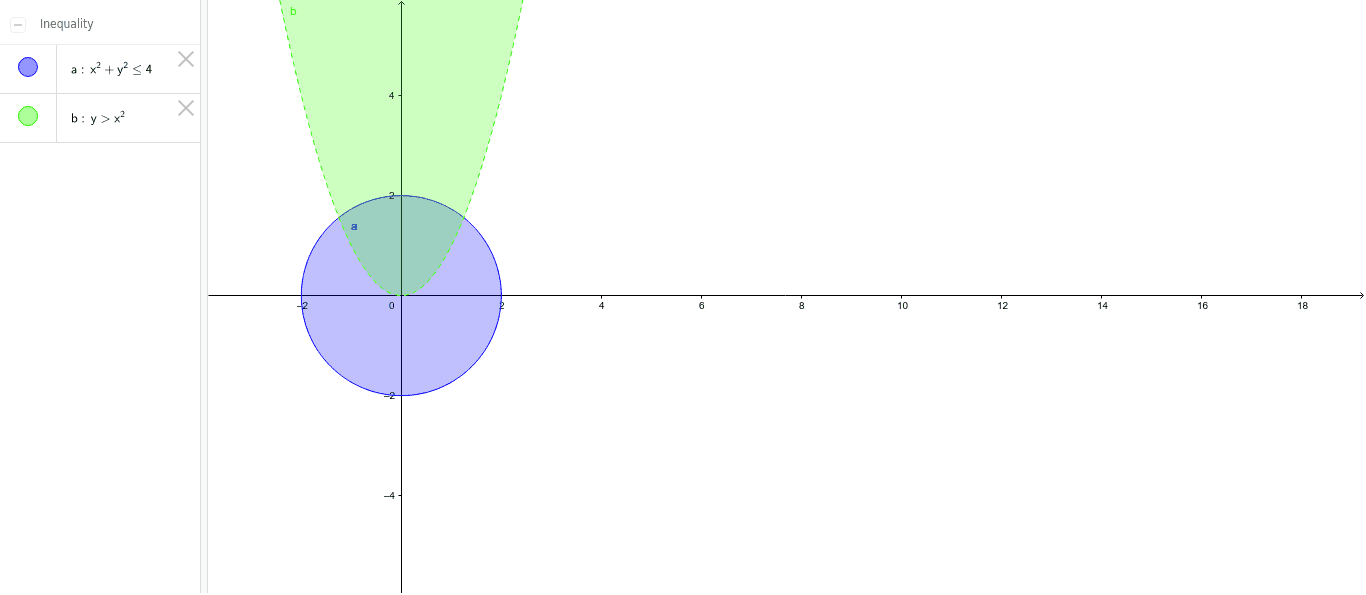
a(x, y) = x^(2) + y^(2) ≤ 4b(x, y) = y > x^(2)
AI Drawing Prompt Reference
Please draw a graph that includes a circle and a parabola. The circle's equation is x^2 + y^2 ≤ 4, representing a circle centered at the origin with radius 2. The parabola's equation is y > x^2, representing the region above the parabola y = x^2. The construction order: first draw the circle, then draw the parabola. The graph should clearly show the interior of the circle and the region above the parabola.
The prompt above was compiled from the original drawing commands and is for reference only.