
IM Alg1.3.8 Practice: Using the Correlation Coefficient
Loading the math board and drawing, please wait…
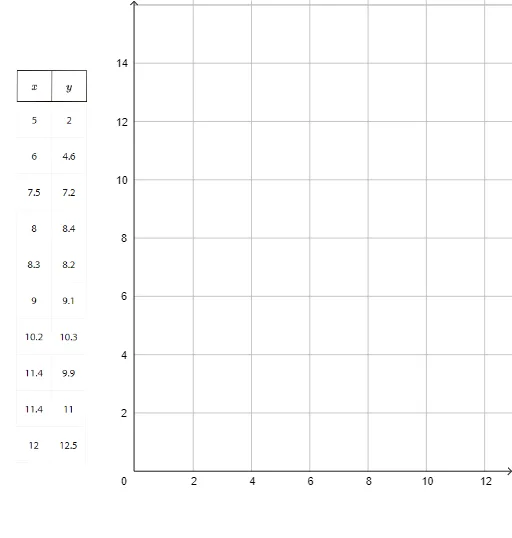
This practice example from Illustrative Mathematics Algebra 1, Unit 3, Lesson 8 focuses on interpreting the correlation coefficient to assess the strength and direction of linear relationships between two variables. It demonstrates scatter plots, positive and negative correlation, and how r values near 1 or -1 indicate strong association while values near 0 indicate weak association. The construction uses multiple point objects (A1-A11, B1-B11) representing paired data, along with points K and L and an image pic1 to support visualization. GeoGebra commands involve creating points with specific coordinates, likely including tools for linear regression or correlation calculation. This resource is suitable for middle-to-high school students learning statistics and data analysis, and can be used for classroom demonstrations or independent practice to build intuition about correlation in real-world datasets.
GeoGebra Commands & Parameters
Point K(-4.316086073242745, -0.14303951712642204)Point L(-1.3215236506109604, -0.15083772447012095)
AI Drawing Prompt Reference
Draw a scatter plot with two points located at coordinates (-4.32, -0.14) and (-1.32, -0.15) to illustrate the distribution of data points and the direction of the linear relationship.
The prompt above was compiled from the original drawing commands and is for reference only.