
IM 8.4.8 Lesson: How Many Solutions?
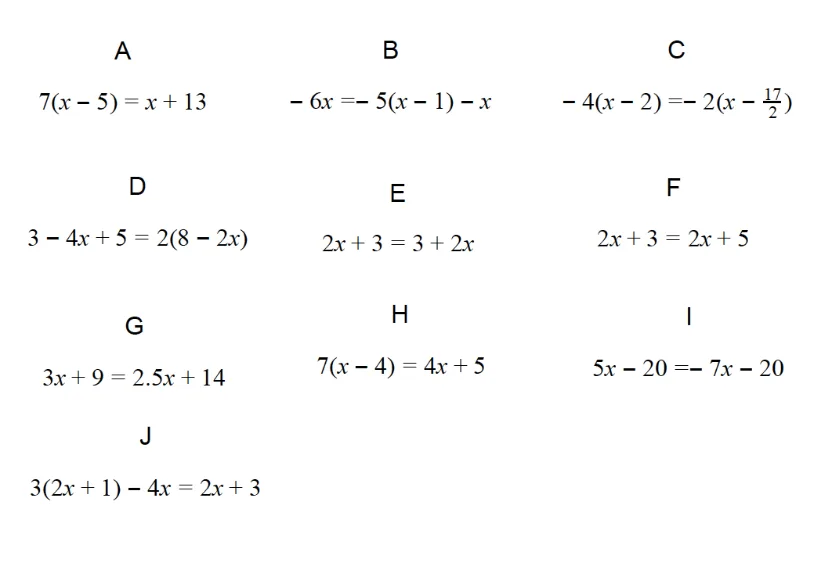
Loading the math board and drawing, please wait…
This GeoGebra example is a lesson companion for Illustrative Mathematics Grade 8, Unit 4, Lesson 8, focusing on determining the number of solutions to equations. It demonstrates how graphical representations—such as lines, parabolas, and their intersections—reveal whether an equation has zero, one, or infinitely many solutions. Core mathematical concepts include linear functions, quadratic functions, the discriminant, and the relationship between graph intersections and solution counts. The construction uses numerous named objects (A, B, pic1 through pic10, etc.), likely including plotted functions, coordinate points, and possibly geometric elements like triangles and incircles, to present multiple scenarios for comparison. This resource is ideal for middle school (Grade 8) or early high school students, and can be used for classroom instruction, group activities, or self-paced exploration to bridge visual intuition and algebraic reasoning.
GeoGebra Commands & Parameters
Point A(-12.024270726963099, 5.414702793982051)Point B(-6.642292362439437, 5.414702793982051)Point C(-4.764325443754584, 5.414702793982052)Point D(1.7627547004549653, 5.414702793982052)Point E(3.2513870140466175, 5.052850631601313)Point F(10.534234332848847, 5.052850631601313)Point G(-12.436507367650018, 1.2511127230441832)Point H(-5.474288547159832, 1.2511127230441832)Point I(-3.7795379132247207, 1.2282106874504657)Point J(1.3276160241743298, 1.2282106874504657)Point K(4.098762331014173, 1.5305175572875394)Point L(9.412034588756681, 1.5305175572875394)Point M(-11.978466655775666, -2.674296177719019)Point N(-6.115545543783932, -2.674296177719019)Point O(-3.8024399488184413, -2.674296177719019)Point P(1.6482445224863733, -2.674296177719019)Point Q(4.259076580170192, -2.5139819285629983)Point R(10.213605834536796, -2.5139819285629983)Point S(-12.207487011712846, -5.917224417789437)Point T(-5.1078559776603525, -5.917224417789437)
AI Drawing Prompt Reference
Draw a coordinate plane with a horizontal reference line. Place multiple groups of points above and below it. In the upper region, put six points: the first four on the same horizontal level, the last two slightly lower. In the middle region, put six points: the first four on one level, the last two slightly higher. In the lower region, put six points: the first four on one level, the last two slightly higher. At the bottom, put four points on the same level. Arrange all points from left to right, forming four roughly parallel rows to illustrate how the number of intersections relates to the number of solutions.
The prompt above was compiled from the original drawing commands and is for reference only.