
IM 8.4.12 Practice: Systems of Equations
Loading the math board and drawing, please wait…
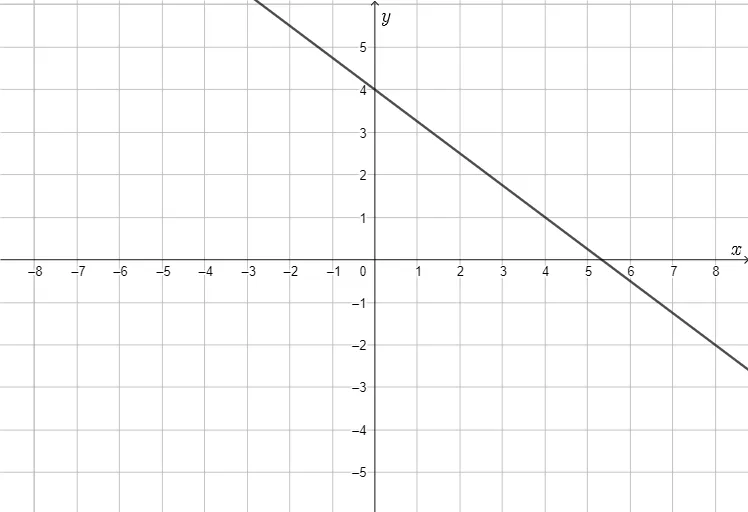
This GeoGebra example demonstrates how to represent a system of linear equations graphically using points and lines. The core mathematical concept is systems of equations, focusing on the solution as the intersection point of two lines, and the geometric interpretation of unique, no, or infinite solutions. The construction uses the Point command to create points A and B, and the Line command to draw line f through these points, representing one linear equation in the coordinate plane. This is suitable for 8th-grade students learning systems of equations, and for teachers to illustrate the connection between algebraic equations and their graphical representations, enhancing understanding of solution types.
GeoGebra Commands & Parameters
Point(yAxis) → ALine(A, B) → f
AI Drawing Prompt Reference
Draw two lines in the coordinate plane, one passing through the origin and the other through the point (1,1), and mark their intersection point to demonstrate how to represent the solution of a system of linear equations graphically. First, draw the line passing through the origin, then draw the line passing through the point (1,1), and finally mark the intersection point of the two lines to observe the solution of the system.
The prompt above was compiled from the original drawing commands and is for reference only.