
IM 8.2.10 Lesson: Meet Slope
Loading the math board and drawing, please wait…
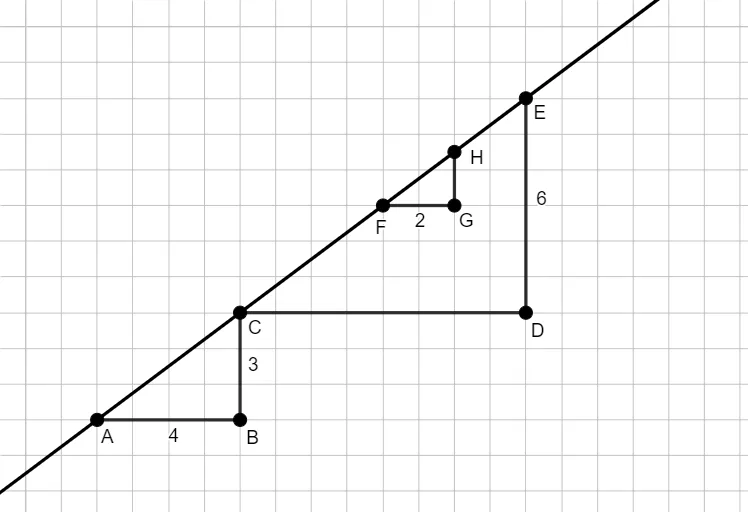
This GeoGebra example is a teaching companion for Illustrative Mathematics Grade 8, Unit 2, Lesson 10, designed to introduce the concept of slope through dynamic geometric construction. It demonstrates how the slope of a line can be visualized as the ratio of vertical change to horizontal change using right triangles formed by points on the line. Core mathematical concepts include slope, proportional reasoning, similarity of right triangles, and coordinate geometry. The construction uses GeoGebra commands such as Point to create key points (A, B, C, etc.), Segment to draw segments, Line to construct lines, and Intersect to find intersection points, resulting in an interactive model where students can manipulate points and observe how slope remains constant. This resource is suitable for middle school (Grade 8) students learning the definition of slope, positive and negative slopes, and slope invariance, and can be used for classroom demonstration or independent exploration.
GeoGebra Commands & Parameters
Point(yAxis) → APoint(xAxis) → BSegment(A, B) → fSegment(B, C) → gSegment(C, D) → hLine(A, E) → iSegment(D, E) → jSegment(F, G) → kIntersect(i, x = 10) → HSegment(G, H) → l
AI Drawing Prompt Reference
On a coordinate plane, place a point on the vertical axis and another on the horizontal axis, then connect them with a segment. From the horizontal-axis point, draw a vertical segment to a third point, then a horizontal segment to a fourth point, forming a right triangle. Through the vertical-axis point, draw a line passing through a fifth point, extending to where it meets a vertical line at x=10. Below the line, connect two points with a segment, then draw a horizontal segment from one of them to the intersection point, forming another right triangle. The figure shows a line with two right triangles to illustrate slope.
The prompt above was compiled from the original drawing commands and is for reference only.