
IM 6.3.9 Practice: Solving Rate Problems
Loading the math board and drawing, please wait…
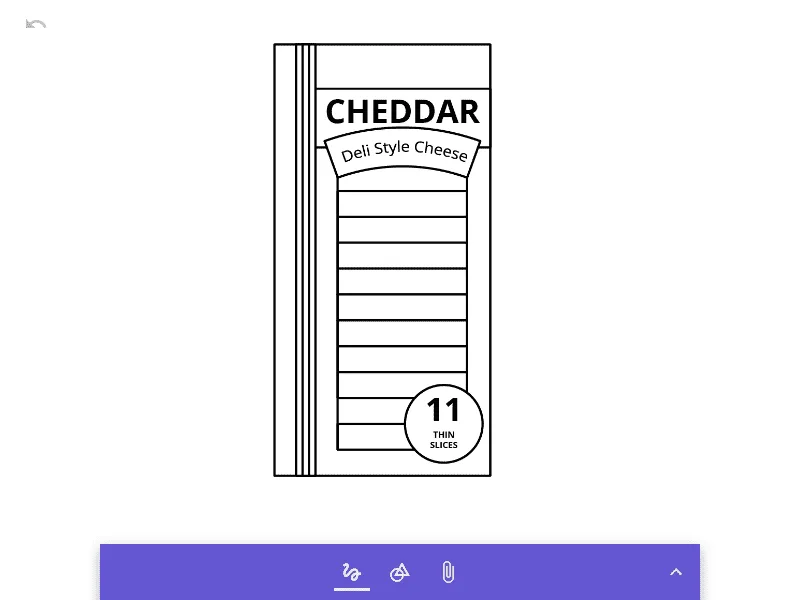
This GeoGebra example demonstrates how to solve rate-related problems in an interactive environment, focusing on understanding ratios, proportions, and unit conversions in real-world contexts. The core mathematical concepts include ratios, proportional relationships, and strategies for solving problems using rates. In terms of construction, the summary only mentions the object 'pic1', indicating that the example likely uses a static image or simple graphic as a background to present the problem scenario, rather than complex dynamic geometric constructions. It is suitable for upper elementary to middle school students (e.g., grade 6) as a practice exercise or classroom demonstration, helping learners connect abstract ratio concepts with concrete problems and enhance their problem-solving skills.
AI Drawing Prompt Reference
Draw a diagram with a simple static image or graphic as the background, showing a real-world problem scenario related to rates and ratios. Draw two rectangles, one representing speed and the other representing time, connected by an arrow to show the relationship between speed and time. Below the rectangles, draw a scale to indicate unit conversion.
The prompt above was compiled from the original drawing commands and is for reference only.