
IM 6.2.8 Lesson: Price per Item
Loading the math board and drawing, please wait…
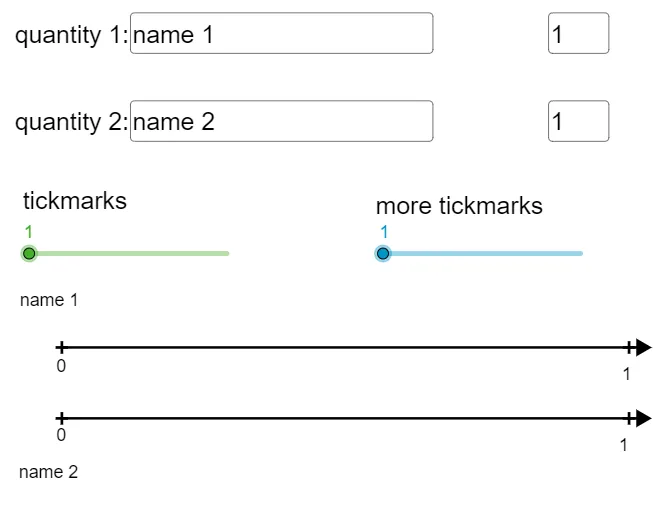
This lesson demonstrates how to calculate the price of one item through random experiments. Key mathematical concepts include natural numbers, random experiments, and combinatorics. Using GeoGebra commands such as Textfield, Point, Segment, GCD, and Sequence, an interactive mathematical model is constructed. Suitable for middle school students learning probability and combinatorics.
GeoGebra Commands & Parameters
Textfield(text4) → InputBox2Textfield(Q1Jump) → InputBox4Textfield(text5) → InputBox3Textfield(Q2Jump) → InputBox5Point(a) → DSegment(A, D) → cSegment(B, C) → dText("20%", (scale - 0.25, y(A) + yOffSet)) → text6Text(8, (scale - 0.12, y(B) + yOffSet)) → text7GCD(Q1Jump, Q2Jump) → gSegment(A, I) → iSegment(B, J) → kText(0, (x(A) - 0.12, y(A) - (1.2 * yOffSet))) → text2Sequence(((e * v), h), v, 0, f) → Q1marksSequence(((e * k), 0), k, 0, f) → Q2marksSequence(Text[(q * Q1Jump), ((e * q) + topxOffSet, y(B) + yOffSet)], q, 1, f) → TextQ1Sequence(Text[(p * Q2Jump), ((e * p) + xOffSet, y(A) + yOffSet)], p, 1, f) → TextQ2Sequence(Text[(q * Q1Jump / 2), ((e / 2 * q) + topxOffSet, y(B) + yOffSet)], q, 1, (f * 2)) → TextQ1split2Sequence(((e / 2 * l), h), l, 0, (f * 2)) → Q1split2Sequence(((e / 2 * k), 0), k, 0, (f * 2)) → Q2split2Sequence(Text[(p * Q2Jump / 2), ((e / 2 * p) + (1.1 * xOffSet), y(A) + yOffSet)], p, 1, (f * 2)) → TextQ2split2Text(0, (x(B) - 0.12, y(B) + (3.2 * yOffSet))) → text3Sequence(((e / s * l), h), l, 0, (f * s)) → Q1splitSequence(((e / s * k), 0), k, 0, (f * s)) → Q2splitSequence(Text[(q * Q1Jump / s), ((e / s * q) + topxOffSet, y(B) + yOffSet)], q, 1, (f * s)) → TextQ1splitSequence(Text[(p * Q2Jump / s), ((e / s * p) + xOffSet, y(A) + yOffSet)], p, 1, (f * s)) → TextQ2split
AI Drawing Prompt Reference
Create an interactive mathematical model demonstrating how to calculate the price of one item through random experiments. Include an input box for data entry, a point and a line segment as key elements, with percentage and numerical labels. Use a slider to control parameters of the random experiments, and generate multiple text labels via sequences to display calculation results, including the greatest common divisor and grouped numerical displays.
The prompt above was compiled from the original drawing commands and is for reference only.