
IM 6.2.6 Practice: Introducing Double Number Line Diagrams
Loading the math board and drawing, please wait…
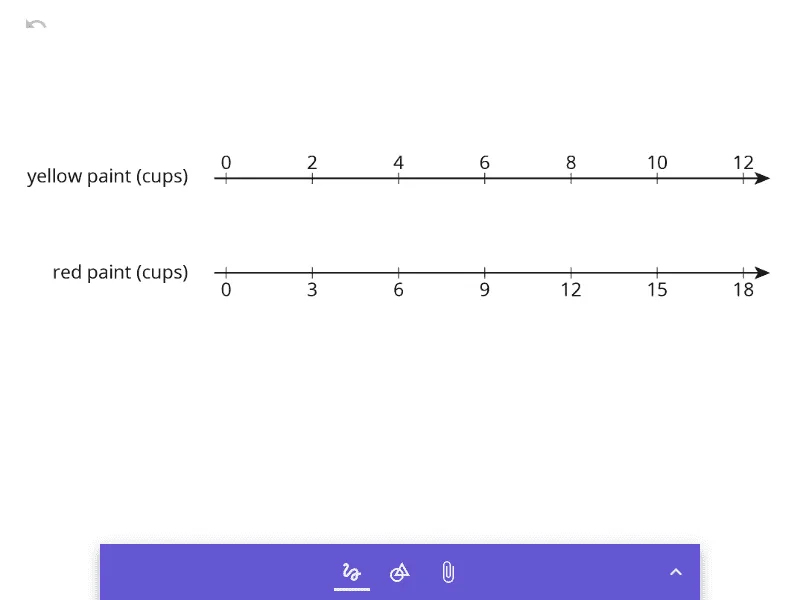
① This example demonstrates how to use a double number line diagram to visually represent proportional relationships between two related quantities, such as unit price, speed, or recipe ratios. ② Core mathematical concepts include ratio, rate, unit conversion, and graphical representation of linear relationships, laying groundwork for later equations and functions. ③ Construction notes: Based on the summary, the example uses an image object (pic1), likely embedding a static diagram or background to show the structure of double number lines; in practice, teachers can use GeoGebra's segment, point, and text tools to draw two parallel number lines with corresponding tick marks. ④ Suitable for middle school (Grade 6) students learning ratio concepts, and useful for classroom demonstrations or independent practice, bridging concrete contexts to abstract proportional models.
AI Drawing Prompt Reference
Draw two parallel and equally spaced horizontal lines as number axes with evenly distributed tick marks and corresponding values labeled on each. Connect corresponding tick marks on the two axes with arrows or lines to show the proportional relationship between quantities. Add text annotations below or beside the axes to explain the ratio or unit conversion, creating a clear and intuitive double number line diagram for educational purposes.
The prompt above was compiled from the original drawing commands and is for reference only.