
i and a Relationship Visualization
Loading the math board and drawing, please wait…
In collections
Complex Math
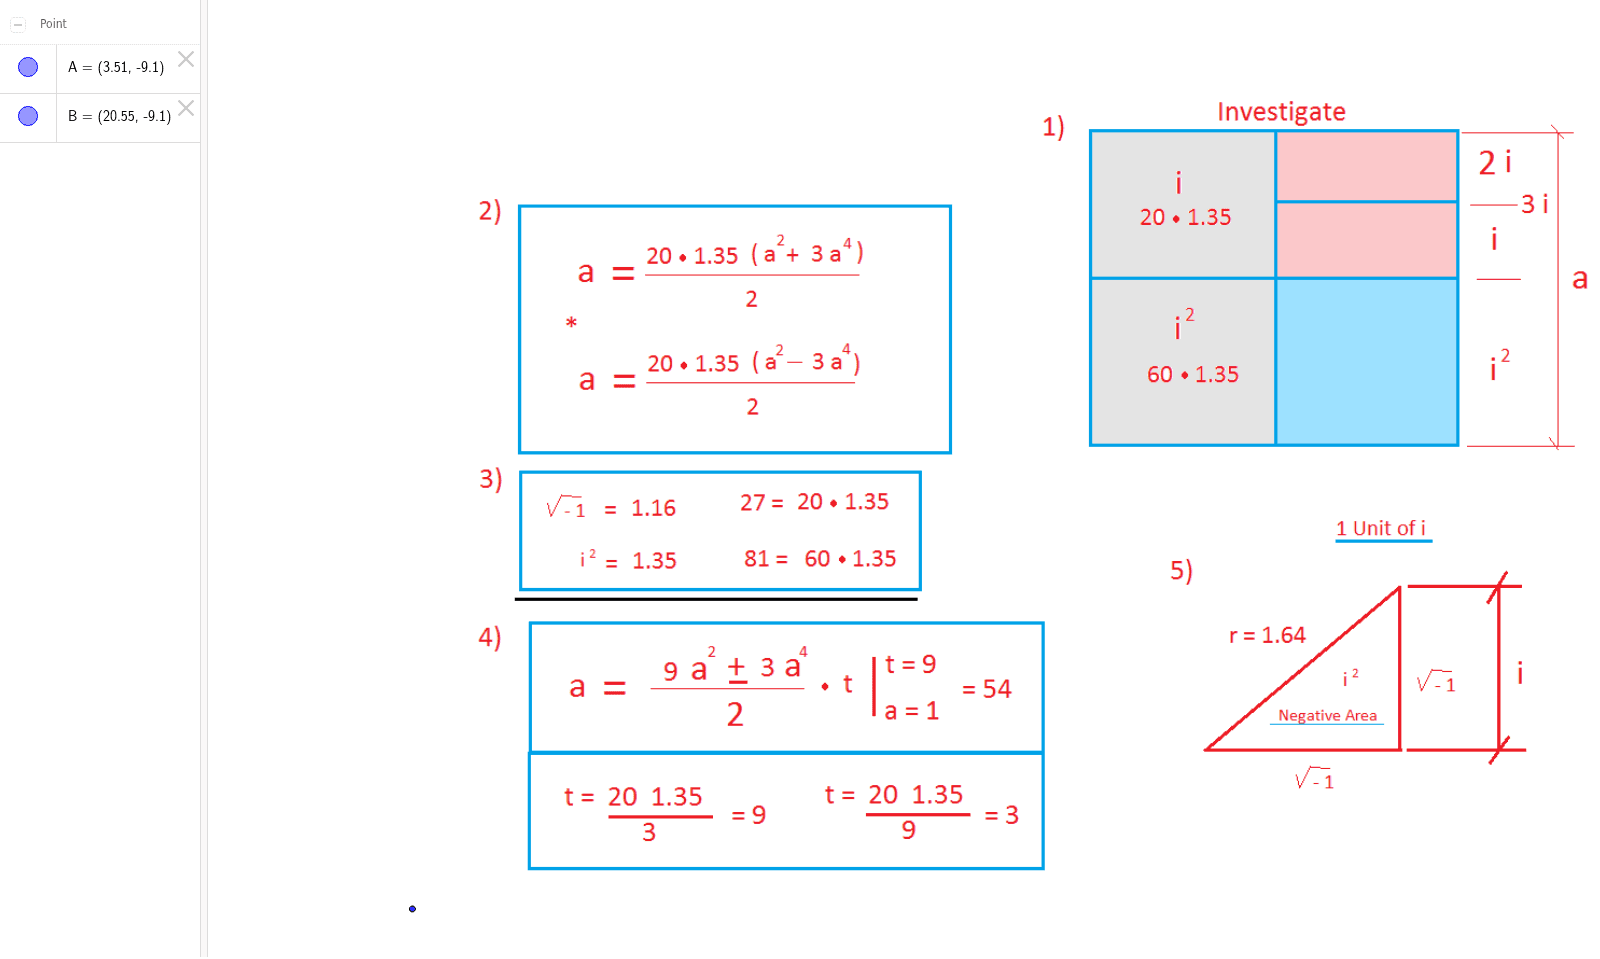
This example dynamically demonstrates the geometric relationship between variables i and a. It involves core math concepts like complex numbers, trigonometry, and geometric construction. Constructed using GeoGebra objects A, B, pic1. Suitable for high school mathematics students and teachers to understand the connection between complex numbers and geometry.
GeoGebra Commands & Parameters
Point A(3.5122614575507134, -9.097816747489922)Point B(20.55226145755071, -9.097816747489922)
AI Drawing Prompt Reference
Draw a Cartesian coordinate system and mark two points on the x-axis, one at approximately (3.51, -9.10) and the other at approximately (20.55, -9.10), showing their horizontal alignment to visualize the relationship between complex numbers and geometry.
The prompt above was compiled from the original drawing commands and is for reference only.