
Hypothesis z-test Example
Loading the math board and drawing, please wait…
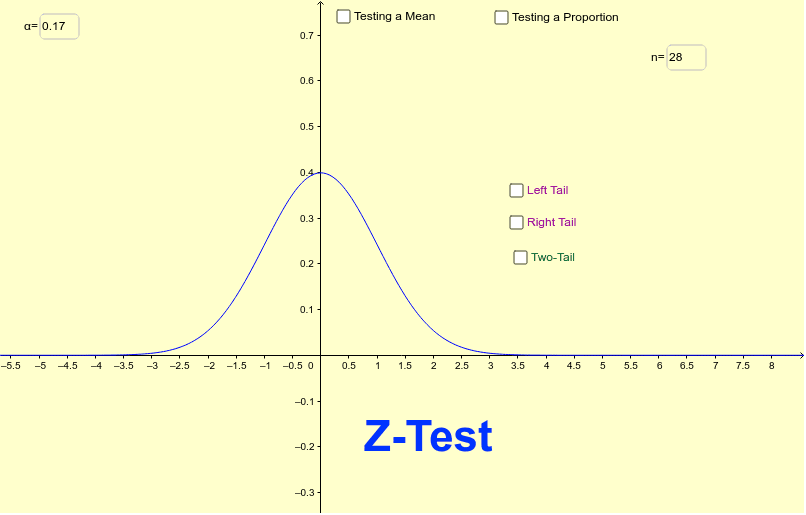
This example demonstrates the graphical representation and process of the z-test in hypothesis testing, involving core mathematical concepts like probability & statistics, symmetry, integral calculations, and distance measurements. It utilizes GeoGebra commands and objects such as InverseNormal, Integral, If, Distance, Segment, and Textfield as outlined in the construction summary. Suitable for high school students and statistics enthusiasts.
GeoGebra Commands & Parameters
InverseNormal(0, 1, 1 - α) → z_αInverseNormal(0, 1, 1 - α / 2) → z_{α/2}Integral(f, -100 + z, z) → p_lIf(e, (z, f(z)), (zm, f(zm))) → AIf(e, ((-z), f((-z))), ((-zm), f((-zm)))) → BIf(e, (z, 0), (zm, 0)) → ZDistance(Z, A) → ZASegment(Z, A) → gIntegral(f, z, z + 100) → p_rTextfield(xb) → inputBox1Textfield(mu) → inputBox2Textfield(sig) → inputBox3Textfield(N) → inputBox4Textfield(ph) → inputBox5Textfield(p) → inputBox6Integral(f, zm, zm + 100) → pmrIntegral(f, -100 + zm, zm) → pmlIntegral(f, -100 - z_α, (-z_α)) → P_{αL}Integral(f, z_α, 100 + z_α) → P_{αR}Integral(f, -100 - z_{α/2}, (-z_{α/2})) → P_{αl}Integral(f, z_{α/2}, 100 + z_{α/2}) → P_{αr}Textfield(α) → inputBox7
AI Drawing Prompt Reference
Create a graphical representation of the z-test for hypothesis testing, showing a normal distribution curve with critical regions on both sides, marking the positions of z_α and z_{α/2}, displaying the integral areas from z to positive infinity and from negative infinity to z, connecting the z-point to the boundary of the rejection region with a line segment, and adding text boxes for inputting parameters α, μ, σ, N, and p.
The prompt above was compiled from the original drawing commands and is for reference only.