
Hypothesis Testing with Normal Distribution
Loading the math board and drawing, please wait…
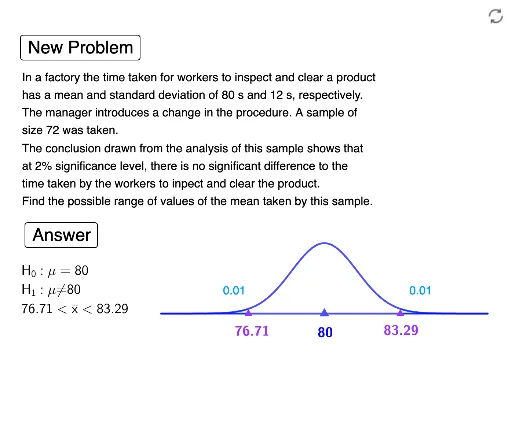
This example demonstrates the application of normal distribution in hypothesis testing, visually showing the relationship between critical values and sample distributions. Core concepts include hypothesis testing, normal distribution, continuity correction, percentage calculations, and integral applications. GeoGebra commands like Random, If, Normal, InverseNormal, and Integral are used, along with objects such as buttons and sliders. Suitable for high school and above students for probability & statistics teaching and learning.
GeoGebra Commands & Parameters
Random(70, 90) → mRandom(55, 75) → nRandom(6, 12) → sIf(a ≟ 1, "no significant", "significant") → text2If(a ≟ 1, text4, text5) → text6Normal(0, 1, x, false) → fInverseNormal(0, 1, α / 2) → z1InverseNormal(0, 1, 1 - α / 2) → z2Integral(g, -5, z1) → bIntegral(g, z2, 5) → c
AI Drawing Prompt Reference
Visualize the application of normal distribution in hypothesis testing, showing the relationship between critical values and sample distributions. Generate two random means and standard deviations, label significance based on test results. Draw a normal distribution curve, calculate the integral areas on both sides to represent critical probabilities, and present the decision-making process of hypothesis testing in relation to the normal distribution.
The prompt above was compiled from the original drawing commands and is for reference only.