
Hyperbolic Navigation
Loading the math board and drawing, please wait…
In collections
geometriadinamica.es
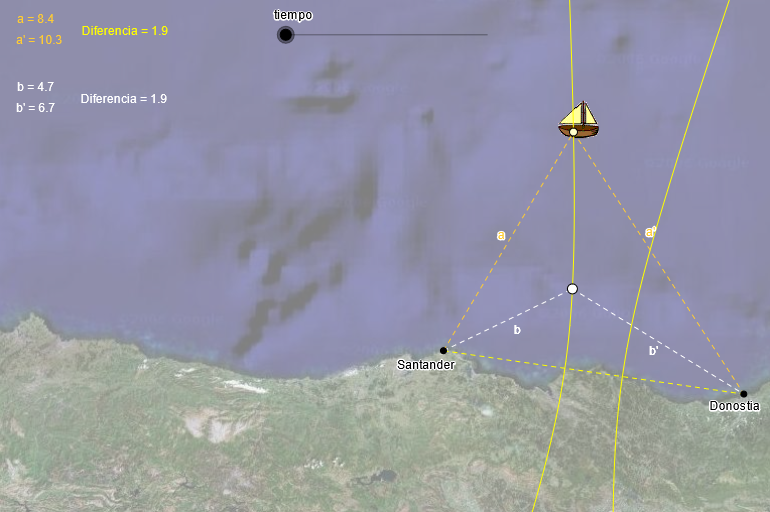
This example demonstrates hyperbolic navigation. Key mathematical concepts include hyperbolas and navigation paths. Using GeoGebra commands such as Hyperbola, Point, Segment, etc., a hyperbolic path can be constructed. Suitable for high school students and researchers.
GeoGebra Commands & Parameters
Hyperbola(Santander, Donostia, a1) → Sant_DPoint(Sant_D) → ASegment(Santander, A) → bSegment(A, Donostia) → b'If(b < b', b', b) → max_bIf(b < b', b, b') → min_bIf(tiempo < max_b, tiempo, max_b) → minT_bIf(tiempo < min_b, 0, 1) → test_bSegment(Santander, B) → aSegment(B, Donostia) → a'If(a < a', a', a) → max_aIf(tiempo < max_a, tiempo, max_a) → minT_aIf(a < a', a, a') → min_aIf(tiempo < min_a, 0, 1) → test_aSegment(Santander, Donostia) → b_1Circle(Santander, tiempo) → cCircle(Donostia, tiempo) → dIf(max_a < max_b, max_b, max_a) → max
AI Drawing Prompt Reference
Draw a graph illustrating hyperbolic navigation, featuring two cities Santander and Donostia, and a time axis. The graph should include hyperbolas, connecting line segments, circles, and the intersection points of the navigation paths. The hyperbolas should be constructed based on the distances between the two cities and the time axis.
The prompt above was compiled from the original drawing commands and is for reference only.