
Hydraulic System Curve: Interactive Pipe Resistance and Pump Operating Point
Loading the math board and drawing, please wait…
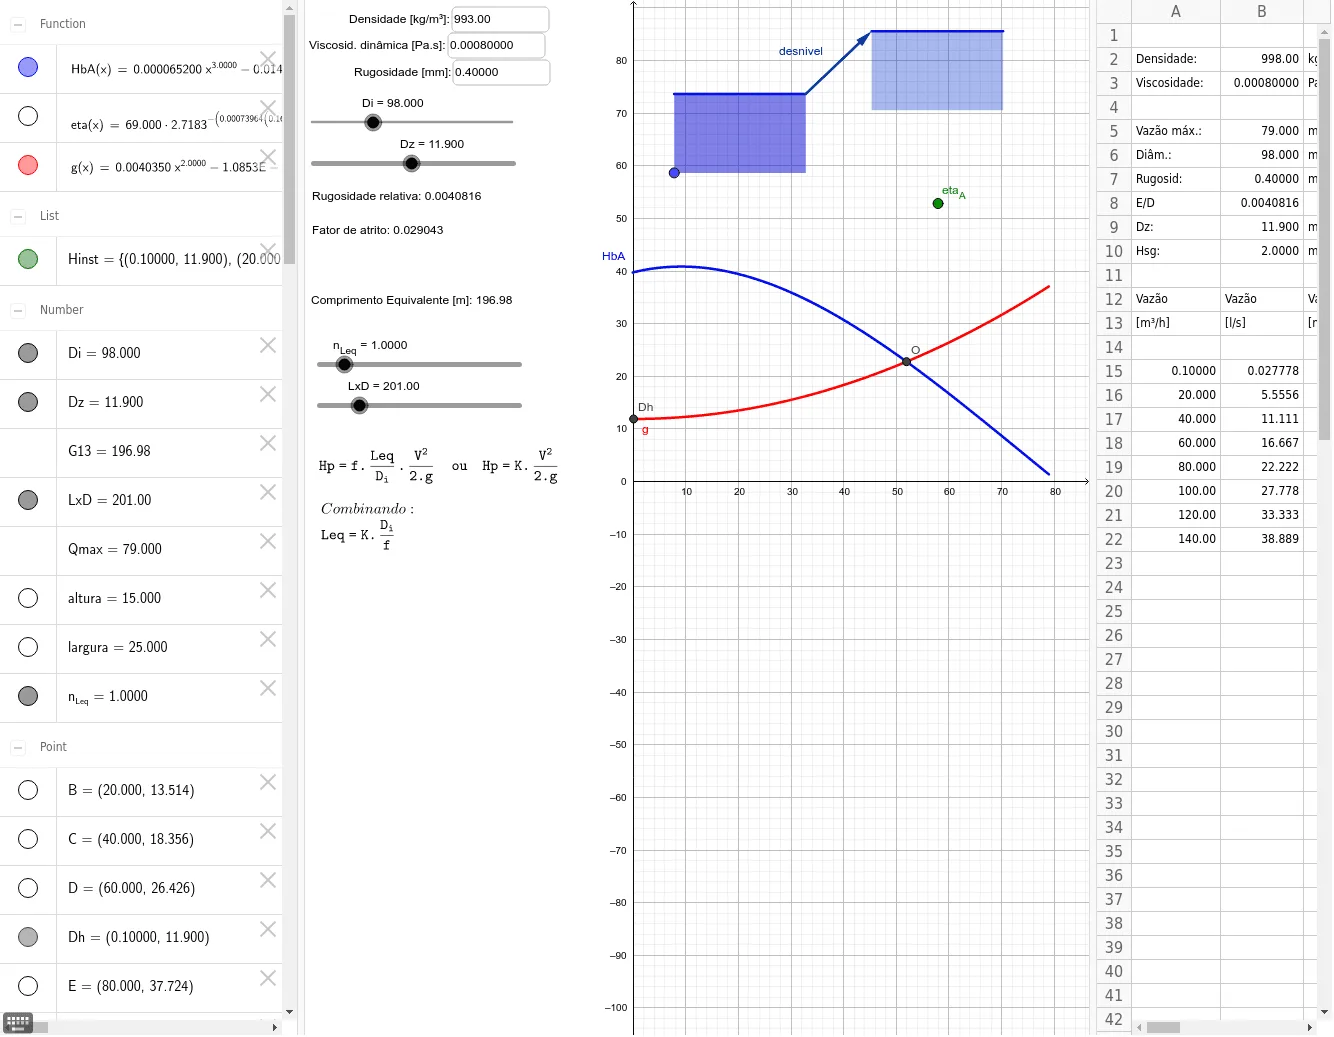
This GeoGebra example demonstrates the construction of a hydraulic system curve, showing how the required head (altura) varies with flow rate (Q) in a pipe network. The core mathematical concepts involve quadratic functions (head loss proportional to flow squared), piecewise functions for different flow regimes, and the intersection of curves to determine the pump operating point. The construction uses GeoGebra commands such as Textfield for parameter input, If for conditional logic, Intersect to find the crossing of pump and system curves, Polygon to shade regions, Vector to indicate flow direction, and Point to mark key locations. Key objects include n_Leq (equivalent length), LxD (length-diameter product), Di (inner diameter), Qmax (maximum flow), altura (head), and numerous auxiliary points (A12~A22, B12~B22, C12~C22) that define the curve geometry and labels. This resource is suitable for high school to university-level courses in fluid mechanics, engineering hydraulics, or applied mathematics, helping students visualize how changing pipe parameters shifts the system curve and affects the operating point. It also serves as an excellent example of parametric modeling and interactive graphing in STEM education.
GeoGebra Commands & Parameters
Textfield(rho) → ct1Textfield(B3) → ct2Textfield(B7) → ct3If(-0.1 < x < Qmax, FitPoly[{Dh, B, C, D, E, F, G, H}, 2]) → gIf(-0.1 < x < Qmax, 6.5194E-5 * x^(3) - 0.014424 * x^(2) + 0.24685 * x + 39.755) → HbAIntersect(HbA, g, (51.95181939364509, 22.790393729113486)) → OPolygon(L, I, J, K) → q1, a, i, j, kPolygon(P, Q, R, S) → q2, a_1, n, p, qVector(K, S) → desnivelPoint(eta) → eta_A
AI Drawing Prompt Reference
Create a hydraulic system curve showing the relationship between required head and flow rate in a pipe network. Include quadratic function curves representing head loss proportional to the square of flow, and piecewise functions for different flow regimes. Mark the intersection of these curves to determine the pump operating point, shade regions with polygons, and indicate flow direction with vectors. Use points to highlight key locations, and show how changing pipe parameters affects the system curve and operating point.
The prompt above was compiled from the original drawing commands and is for reference only.