
How Well Can You Measure?
Loading the math board and drawing, please wait…
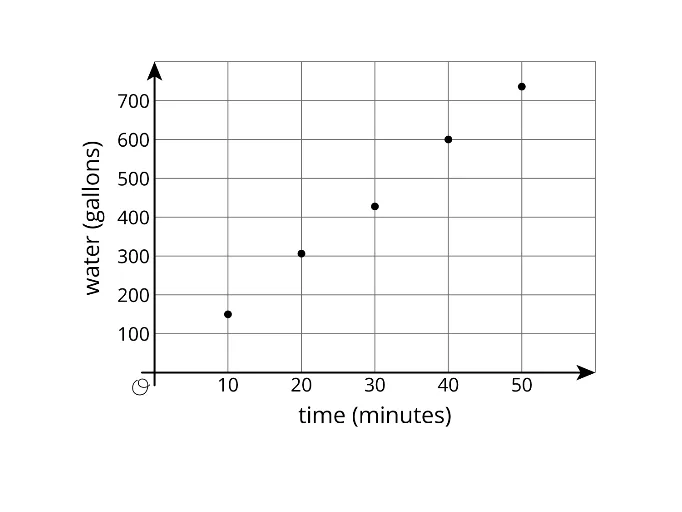
This example demonstrates how to use GeoGebra for precise measurement, involving core math concepts like Probability & Statistics and data visualization (Boxplot and Pie Chart/Circle Chart). Construction highlights include using the GeoGebra object pic1 to display measurement results. Suitable for middle school and above students to understand measurement error and data representation.
AI Drawing Prompt Reference
Create a graph showing probability and statistical measurement results, including a box plot and a pie chart. Use an object named pic1 to display the measurement results, illustrating basic concepts of probability and data visualization. First, create a set of data points, then calculate their statistics, followed by drawing the box plot and pie chart, and finally displaying the results in pic1.
The prompt above was compiled from the original drawing commands and is for reference only.