
Histogram with GeoGebra
Loading the math board and drawing, please wait…
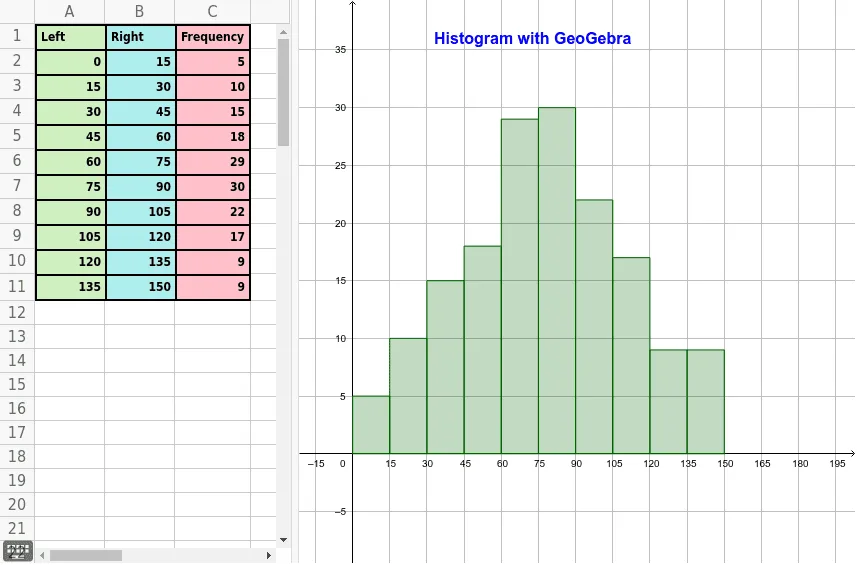
This example demonstrates how to create a histogram using GeoGebra. Key mathematical concepts include data grouping and statistics. The construction summary mentions the use of the Histogram command and several objects such as A1, B1, C1, etc. Suitable for middle school and above students to learn data statistics and chart drawing.
GeoGebra Commands & Parameters
Histogram(list1, list2) → a
AI Drawing Prompt Reference
Create a histogram to show the relationship between two sets of data, presenting frequency by grouping and statistics, suitable for learning data statistics and chart drawing.
The prompt above was compiled from the original drawing commands and is for reference only.