
Histogram with Equal Class Intervals
Loading the math board and drawing, please wait…
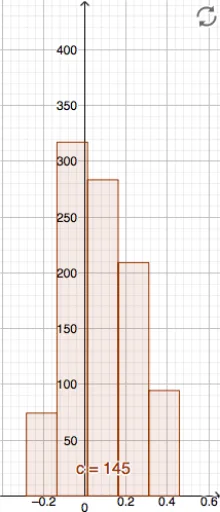
This GeoGebra example demonstrates how to construct a histogram with equal class intervals, providing a clear visual representation of the frequency distribution of a dataset. The core mathematical concept is descriptive statistics, specifically frequency tables and histograms, where equal bin widths ensure that bar heights are proportional to frequencies, allowing accurate comparison of data density across intervals. The construction uses the Histogram command with objects Hs (data list), Cs (class boundaries), and c (color or style parameter) to generate the plot. Users can modify the class width and boundaries to explore how the distribution shape changes. This resource is ideal for middle school, high school, or introductory college statistics courses, helping students grasp data grouping, frequency counting, and the distinction between histograms and bar charts.
GeoGebra Commands & Parameters
Histogram(Cs, Hs) → c