
Histogram Construction Example by Neeraj Gupta
Loading the math board and drawing, please wait…
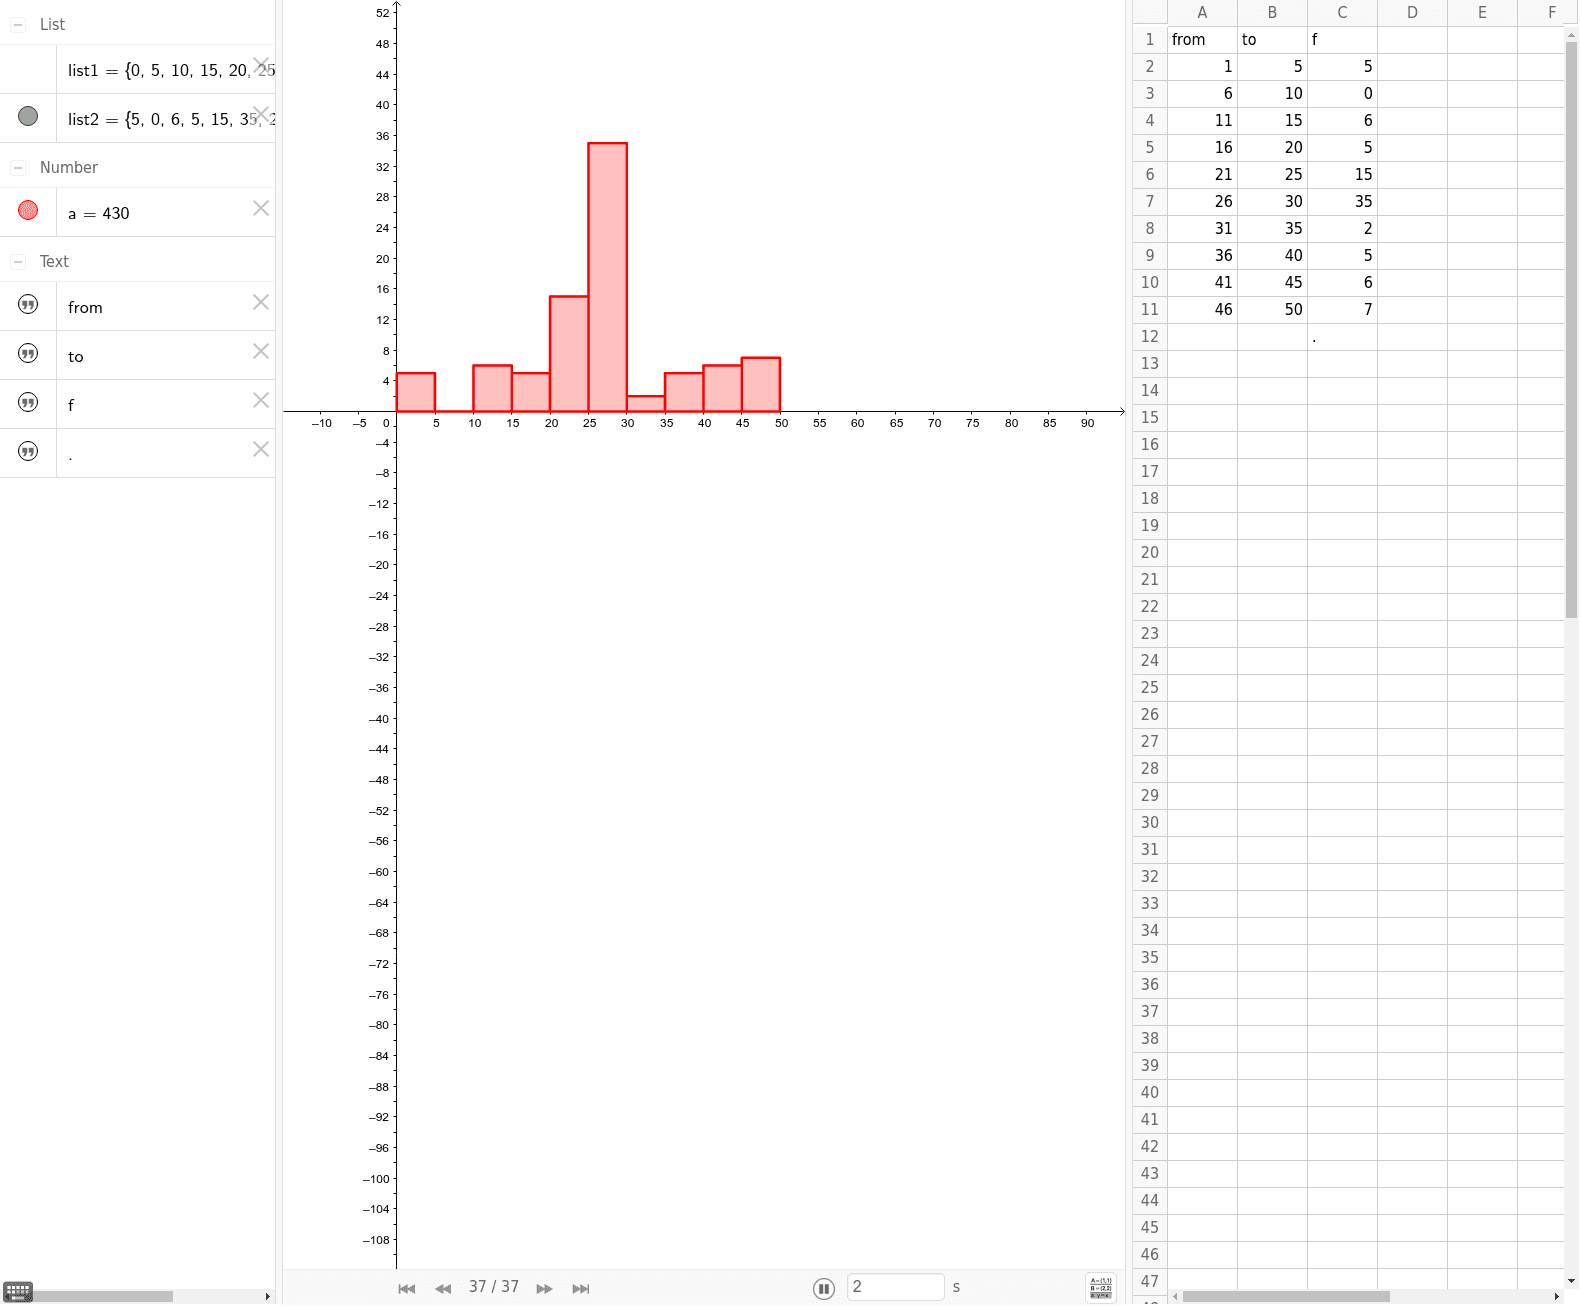
This example demonstrates how to construct a histogram using GeoGebra, illustrating data distribution. Key math concepts include data statistics, frequency distribution, and bar graph plotting. Construction involves commands like Histogram with objects A1-B10, C1-C12, list1, list2, a. Suitable for high school statistics and data analysis education.
GeoGebra Commands & Parameters
Histogram(list1, list2) → a
AI Drawing Prompt Reference
Create a histogram to illustrate data distribution using two datasets, one with 10 data points and the other with 12, where the histogram is generated from the frequency distributions of these datasets, clearly showing the data distribution.
The prompt above was compiled from the original drawing commands and is for reference only.