
Histogram by pirsquared
Loading the math board and drawing, please wait…
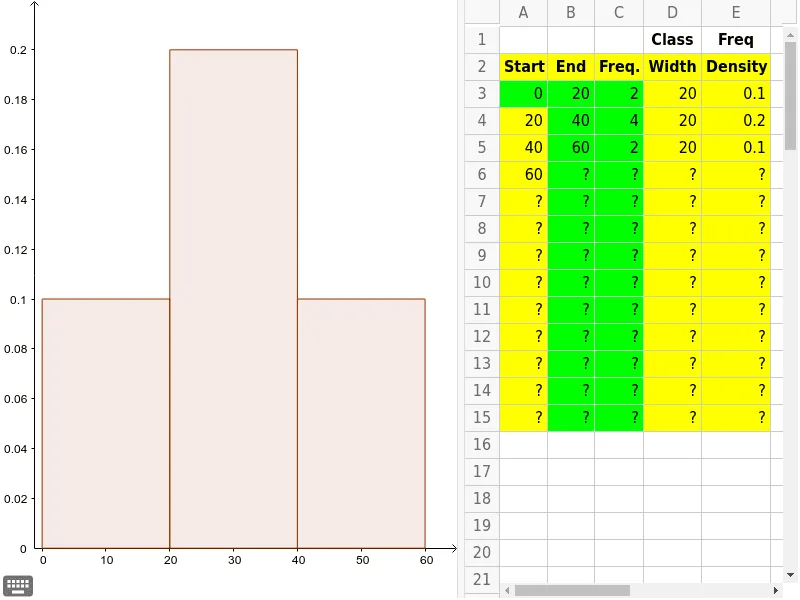
This example demonstrates how to create a histogram using GeoGebra commands such as Join and Histogram. A histogram is a statistical chart that shows the distribution of data. This example is suitable for middle school mathematics education, particularly in statistics and probability & statistics courses.
GeoGebra Commands & Parameters
Join({{A3}, RemoveUndefined[B3:B14]}) → BoundsRemoveUndefined(E3:E15) → FreqsHistogram(Bounds, Freqs) → a
AI Drawing Prompt Reference
Draw a statistical histogram to show data distribution, first connect a set of data points to form boundary lines, then use these boundaries and corresponding frequency data to plot histogram bars, the histogram should clearly display the data distribution.
The prompt above was compiled from the original drawing commands and is for reference only.