
Histogram and Mean, Median
Loading the math board and drawing, please wait…
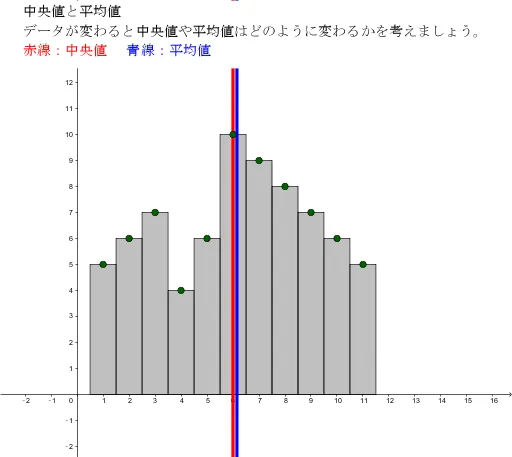
This example demonstrates the creation of a histogram and the calculation of its mean and median. Key mathematical concepts include statistics, histograms, mean, and median. Using GeoGebra commands like Sequence, the construction process of the histogram is dynamically shown. Suitable for middle school and above students to learn statistical concepts.
GeoGebra Commands & Parameters
Sequence(Polygon[(i - 0.5, 0), (i + 0.5, 0), (i + 0.5, y(Element[l1, i])), (i - 0.5, y(Element[l1, i]))], i, 1, 11) → l2Sequence(i, i, 1, 11) → l3
AI Drawing Prompt Reference
Draw a histogram with 11 bars, where the height of each bar is determined by a set of data. The bars should be placed closely together along the x-axis, with their tops connected by a dashed line to form a polyline. Also, indicate the mean and median of the data set with horizontal and vertical lines respectively, ensuring all elements are clearly visible.
The prompt above was compiled from the original drawing commands and is for reference only.