
Guess the Least Squares Regression Line
Loading the math board and drawing, please wait…
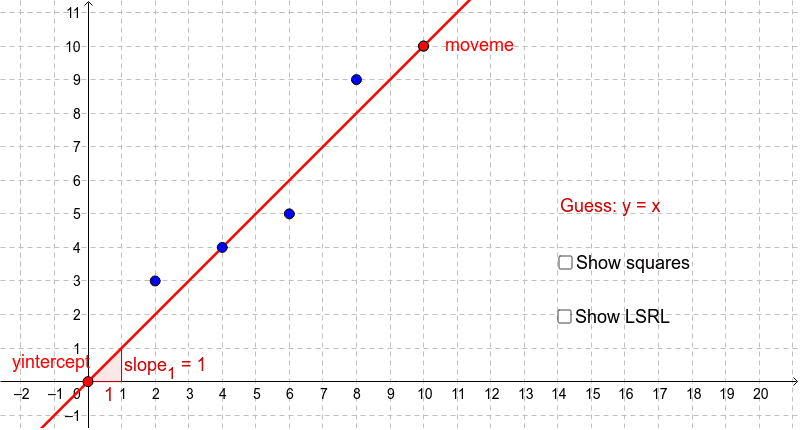
Adjust the line using the provided points to guess the least squares regression line, understanding the concept of linear regression. This example uses commands such as Point, Line, OrthogonalLine, Intersect, Polygon, Sum, FitLineY, PMCC, Slope. Suitable for middle school and above students to learn linear regression and statistical analysis.
GeoGebra Commands & Parameters
Point(yAxis) → yinterceptLine(yintercept, moveme) → fOrthogonalLine(A, xAxis) → aOrthogonalLine(E, xAxis) → eOrthogonalLine(B, xAxis) → bOrthogonalLine(D, xAxis) → dOrthogonalLine(C, xAxis) → cIntersect(a, f) → faIntersect(e, f) → feIntersect(b, f) → fbIntersect(f, c) → fcIntersect(d, f) → fdPolygon(A, fa, 4) → polyA_1, p_1, h, i, j, M, NPolygon(fe, E, 4) → polyE_1, p_2, l, m, n, O, PPolygon(B, fb, 4) → polyB_1, p_3, q, r, s, Q, RPolygon(fd, D, 4) → polyD_1, p_4, a_1, b_1, c_1, S, TPolygon(fc, C, 4) → polyC_1, p_5, e_1, f_1, g_1, U, VSum(A1:A5) → A6FitLineY({A, B, C, D, E}) → gPMCC({A, B, C, D, E}) → uIntersect(a, g) → gaIntersect(b, g) → gbIntersect(c, g) → gcIntersect(d, g) → gdIntersect(e, g) → geIntersect(g, x = 0) → FSlope(f) → slope_1Slope(g) → slope_2
AI Drawing Prompt Reference
Draw a coordinate system and add five points A, B, C, D, and E. Adjust these points to find a line that best fits them as a least squares regression line. Then, draw the least squares regression line g and calculate its slope. Finally, draw perpendicular lines from each point to line g, and find the intersection points of these perpendicular lines with the x-axis, as well as the intersection point F of line g with the x-axis.
The prompt above was compiled from the original drawing commands and is for reference only.