
Guess the Game!
Loading the math board and drawing, please wait…
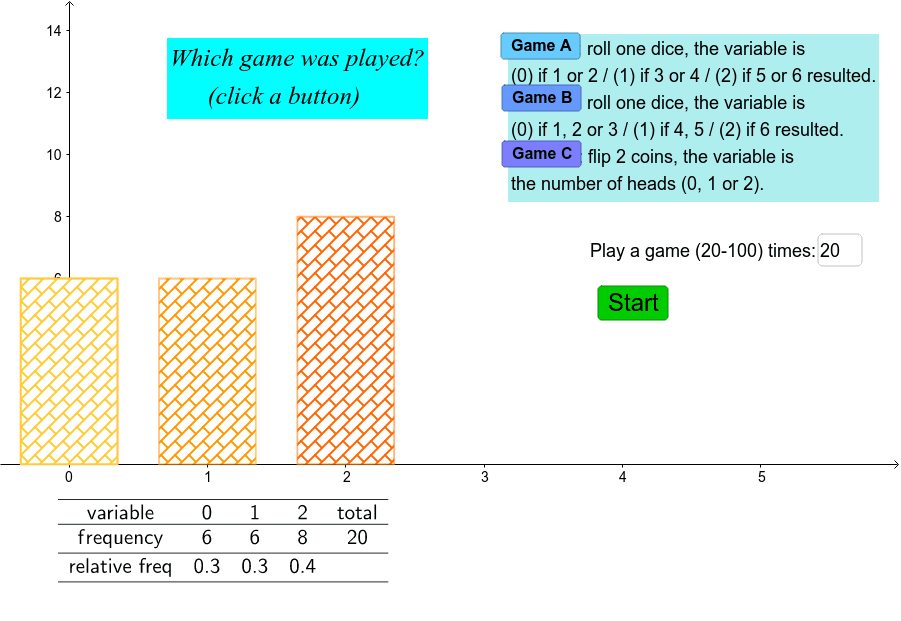
This example demonstrates how to simulate probability games using interactive charts and random number generators. It involves core math concepts like Median Value, Poisson Distribution, Quadratic Functions, Vectors 3D, and Geometric Mean. Construction highlights include GeoGebra commands such as Frequency, Sum, Unique, Random, Append, TableText, Textfield, and BarChart. Suitable for high school and above students learning probability statistics and function graphing.
GeoGebra Commands & Parameters
Frequency(sumlist) → freqSum(freq) → bUnique(sumlist) → list1Random(0, 1) → coin2Random(0, 1) → coin1Append("frequency", freq) → row2Append("variable", list1) → row1Append("relative freq", rel) → row3Append(row1, "total") → row1aAppend(row2, b) → row2aTableText({row1a, row2a, row3}, "c_") → tableTextfield(ism) → inputBox1Random(1, 3) → gameRandom(1, 6) → diceBarChart(sumlist, 0.7) → a