
Grid-Based Two Dice Roll Simulation
Loading the math board and drawing, please wait…
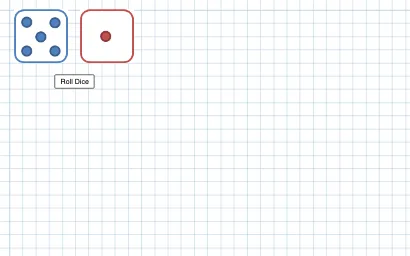
This GeoGebra example demonstrates a two-dice random experiment by placing outcomes onto a grid, making the evolving distribution of sums (and related events) visually accessible. It centers on probability and statistics ideas for discrete random variables, including addition over integers, logical filtering of outcomes, and the use of combinatorial viewpoints associated with hypergeometric distribution (as referenced by the original tags). Construction-wise, it uses the GeoGebra Random command to generate dice results and the Segment command to build the geometric elements that represent dice faces/marks. Objects such as Roll, A, and B, together with multiple display items (e.g., pic1–pic12) and a controlling object s, are used to render and update the grid visualization for repeated trials. Suitable for secondary school probability lessons, introductory university courses, and classroom demonstrations of stochastic simulations.
GeoGebra Commands & Parameters
Random(1, 6) → bRandom(1, 6) → rSegment(A, B) →
AI Drawing Prompt Reference
Create a grid-based simulation showing a two-dice random experiment on a coordinate plane. Generate two random values from 1 to 6 to represent the first and second die outcomes, and display each outcome as an updated marker corresponding to its face value. Then draw a line segment connecting the two outcome markers on the same canvas, using it as the geometric trace for each trial. Make the markers and connected segment update through repeated trials so viewers can visually inspect how the outcomes populate the grid and relate to the distribution of the dice sum.
The prompt above was compiled from the original drawing commands and is for reference only.