
Graphs of Quadratic Functions (I)
Loading the math board and drawing, please wait…
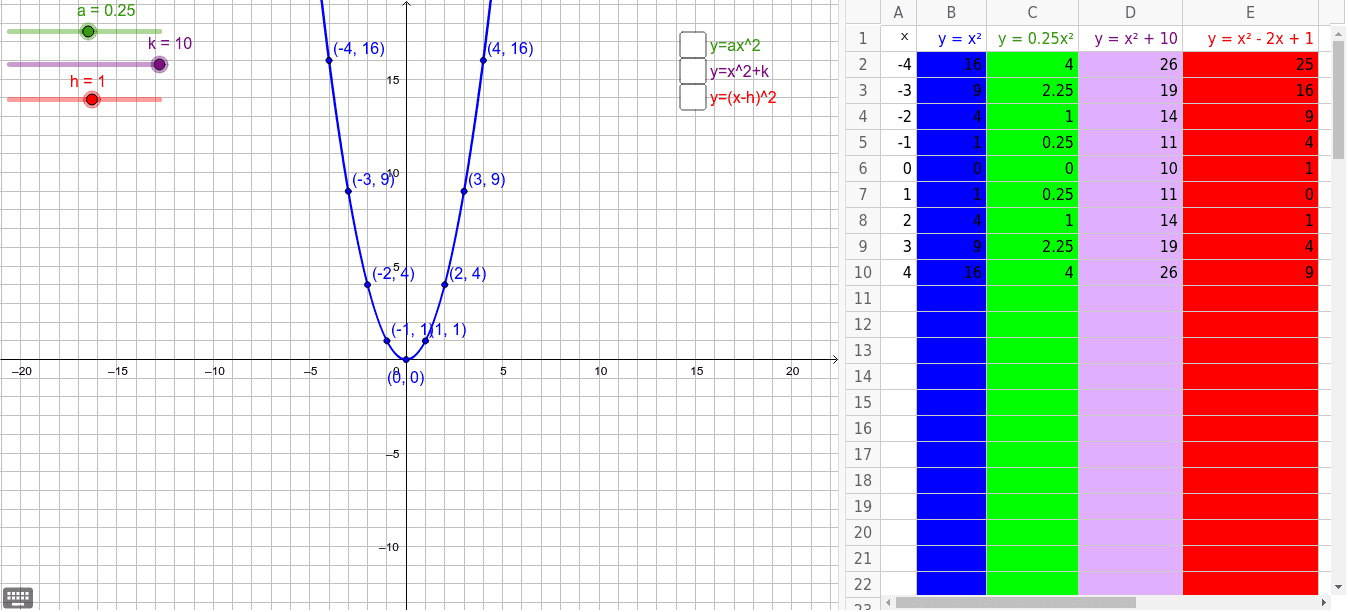
This example demonstrates the graphs of quadratic functions, focusing on the properties and characteristics of quadratic functions. It uses vector commands to dynamically adjust the position and shape of the function graph. Suitable for secondary school mathematics education.
GeoGebra Commands & Parameters
Vector(A_1, B_1) → bb1Vector(A_2, B_2) → bb2Vector(A_3, B_3) → bb3Vector(A_4, B_4) → bb4Vector(A_5, B_5) → bb5Vector(A_6, B_6) → bb6Vector(A_7, B_7) → bb7Vector(A_8, B_8) → bb8Vector(A_9, B_9) → bb9Vector(A_1, C_1) → cc1Vector(A_2, C_2) → cc2Vector(A_3, C_3) → cc3Vector(A_4, C_4) → cc4Vector(A_5, C_5) → cc5Vector(A_6, C_6) → cc6Vector(A_7, C_7) → cc7Vector(A_8, C_8) → cc8Vector(A_9, C_9) → cc9Vector(A_1, D_1) → dd1Vector(A_2, D_2) → dd2Vector(A_3, D_3) → dd3Vector(A_4, D_4) → dd4Vector(A_5, D_5) → dd5Vector(A_6, D_6) → dd6Vector(A_7, D_7) → dd7Vector(A_8, D_8) → dd8Vector(A_9, D_9) → dd9
AI Drawing Prompt Reference
Draw a dynamically adjustable graph of a quadratic function using vector tools to control key points, showcasing the function's graph and its characteristics, suitable for secondary school mathematics education.
The prompt above was compiled from the original drawing commands and is for reference only.