
Graphs of Numbers Under 100 in Base 10 & 5
Loading the math board and drawing, please wait…
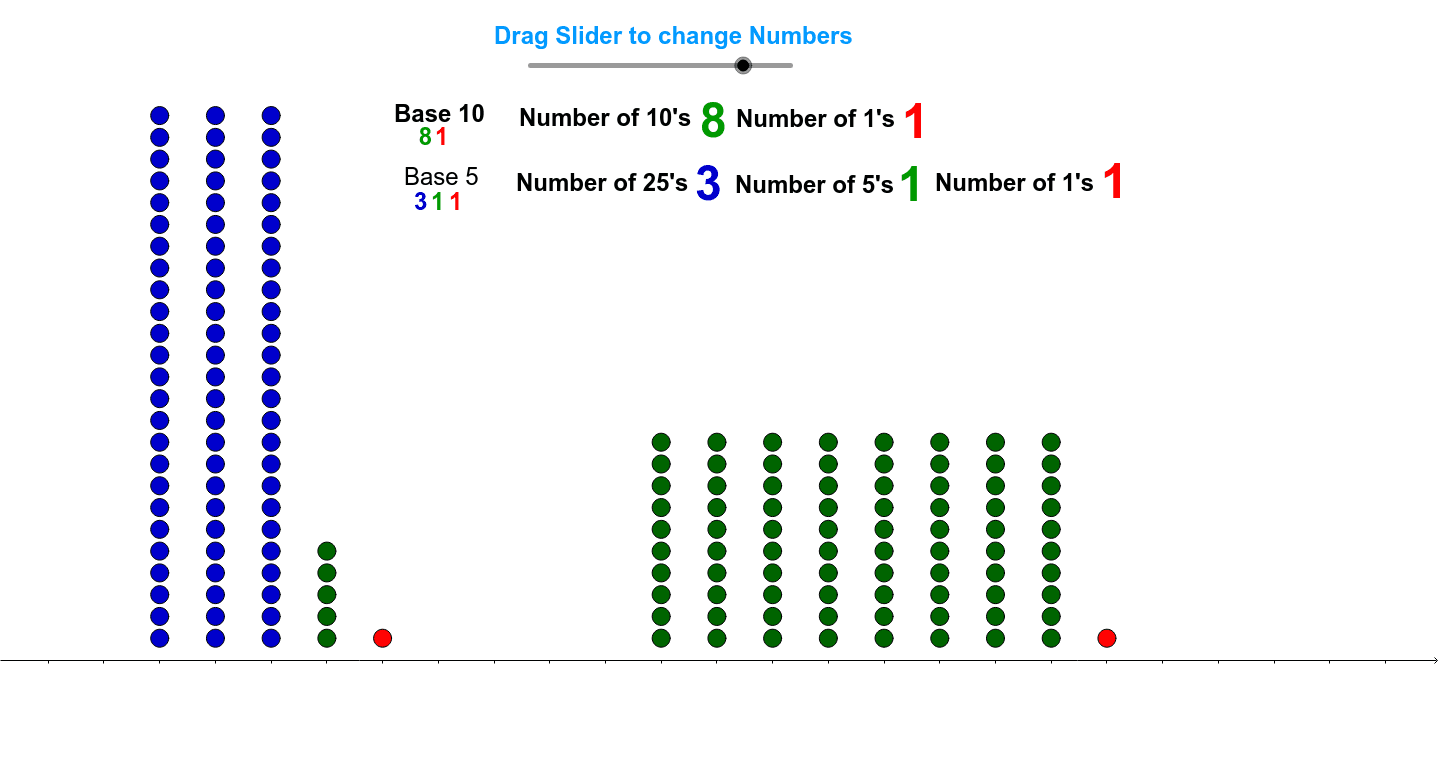
This example demonstrates the representation of numbers under 100 in both base 10 and base 5. Key mathematical concepts include number base conversion and representation. Using the Sequence command to generate sequences, and handling tens and ones, this example provides a visual way to understand number structures in different bases. Suitable for high-grade elementary and low-grade middle school students to learn about number base conversion.
GeoGebra Commands & Parameters
Sequence((Twentyfive + fives + 1, o), o, 1, ones) → list1Sequence(Sequence[(t, o), o, 1, 25], t, 1, Twentyfive) → list3Sequence(Sequence[(t + Twentyfive, o), o, 1, 5], t, 1, fives) → list2Sequence((tensb_10 + 10, o), o, 1, onesb_10) → list4Sequence(Sequence[(t, o), o, 1, 10], t, 10, tensb_10 + 9) → list5
AI Drawing Prompt Reference
Visualize the representation of numbers less than 100 in both base 10 and base 5, showing the tens and ones for each number. Use sequences to generate the positions of each number, first for base 5, then for base 10, and finally display the two sequences side by side to compare their differences and conversion relationships.
The prompt above was compiled from the original drawing commands and is for reference only.