
Graphs of Logarithmic Functions by kotze223
Loading the math board and drawing, please wait…
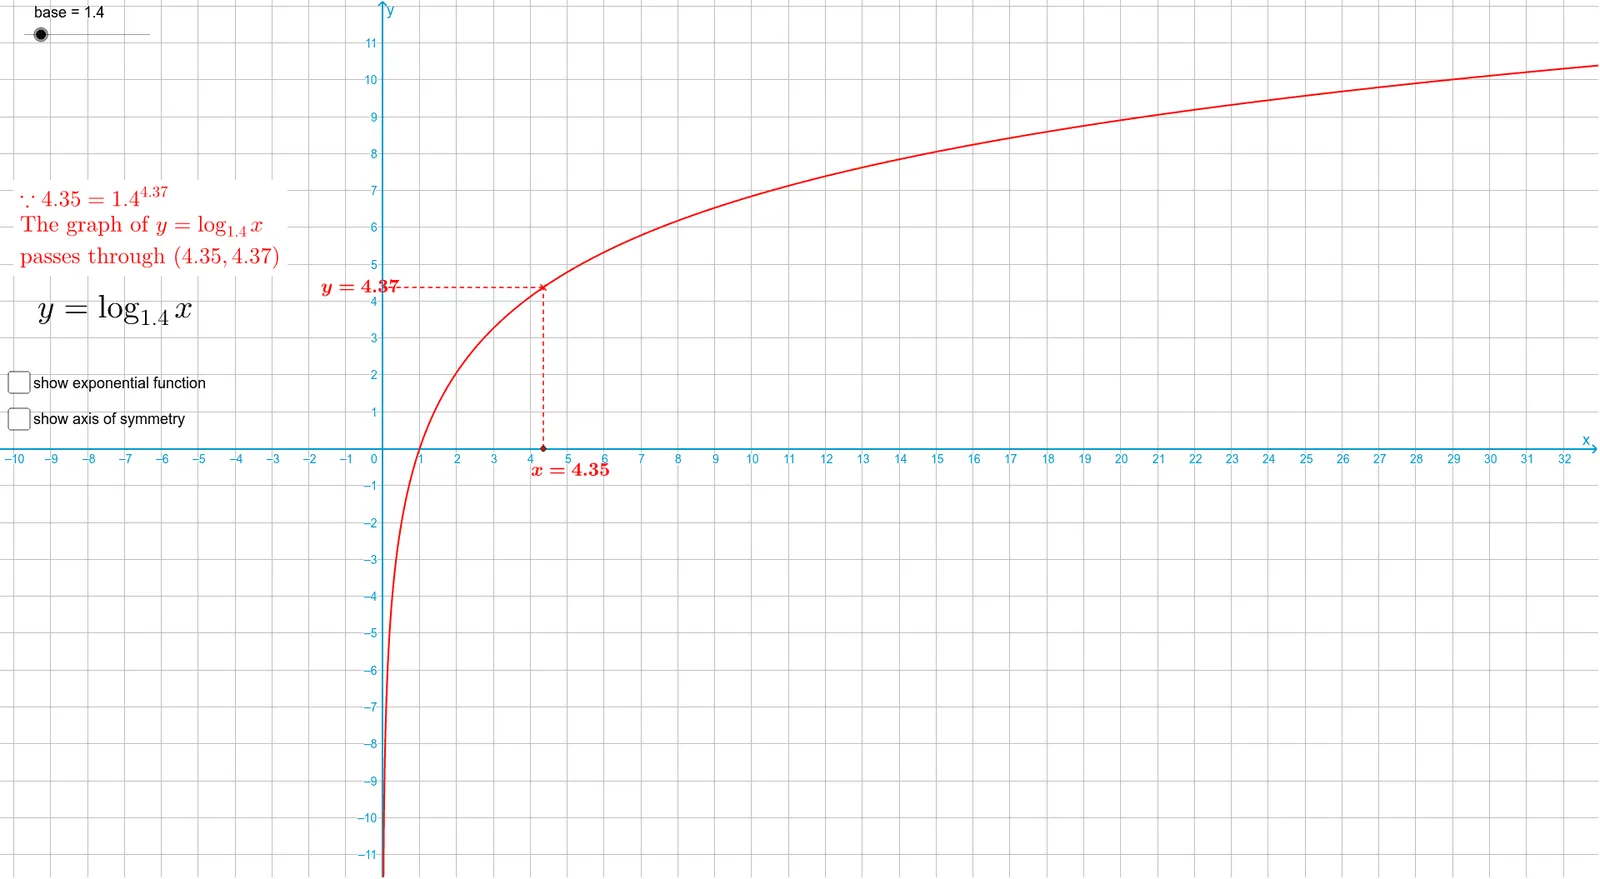
This example demonstrates the graphical features of logarithmic functions and their construction. Key mathematical concepts include logarithmic functions, curve sketching, and coordinate transformations. Construction involves GeoGebra commands such as Point, Segment, and Mirror. Suitable for high school mathematics learning or teaching.
GeoGebra Commands & Parameters
Point(xAxis) → ASegment(A, B) → bSegment(B, C) → cMirror(A, L) → A'_1Mirror(A, L) → A'_2Mirror(B, L) → B'_1Mirror(C, L) → C'Segment(B'_1, C') → c'Mirror(A, L) → A'Mirror(B, L) → B'Segment(A', B') → b'
AI Drawing Prompt Reference
Draw a coordinate-plane figure related to the construction of logarithmic-function graphs. Start with a point on the horizontal axis, then add two more points and connect them in order to form two line segments. Choose a straight line and reflect the original points across it to obtain several mirrored points. Finally, connect the corresponding mirrored points to create two new line segments. The result should show the original broken line, the reflecting line, the symmetric points, and the reflected segments, illustrating coordinate transformation and graphical features of logarithmic functions.
The prompt above was compiled from the original drawing commands and is for reference only.